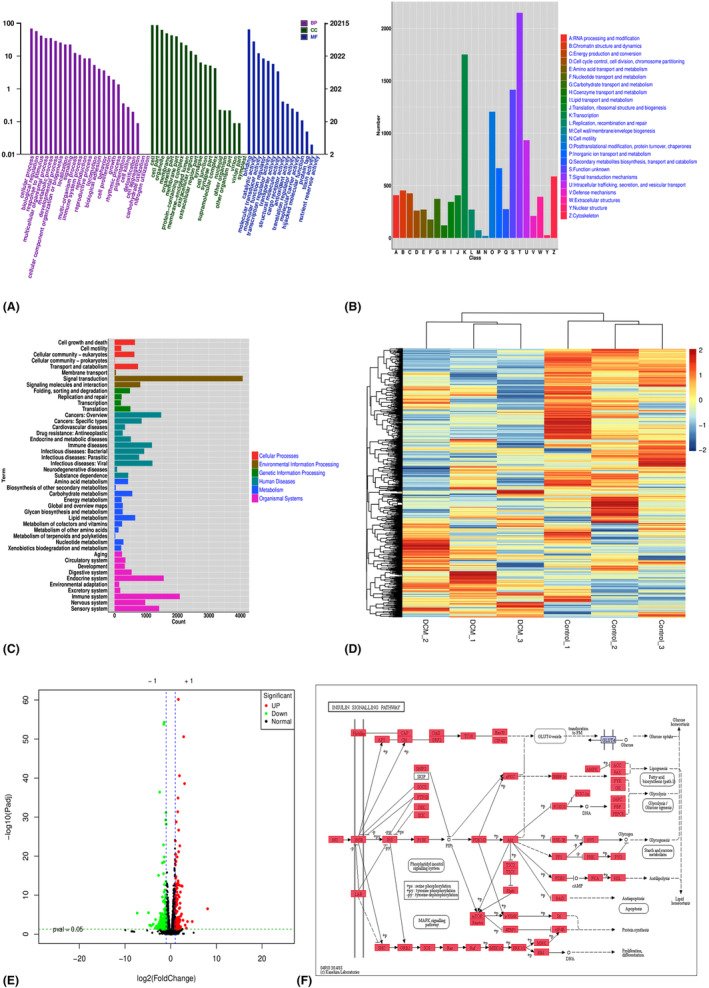
FIGURE 1.

Sequencing data of the diabetic cardiomyopathy model (GSE197999). (A, B) Analysis of module–trait relationships and correlation coefficient of the diabetic cardiomyopathy model based on Gene Expression Omnibus data. (C, D) Enriched Gene Ontology and Kyoto Encyclopedia of Genes and Genomes pathway analyses of mRNAs in the Tan module. The size of the spots corresponds to the number of mRNAs. The colour of the spots represents the p value.
