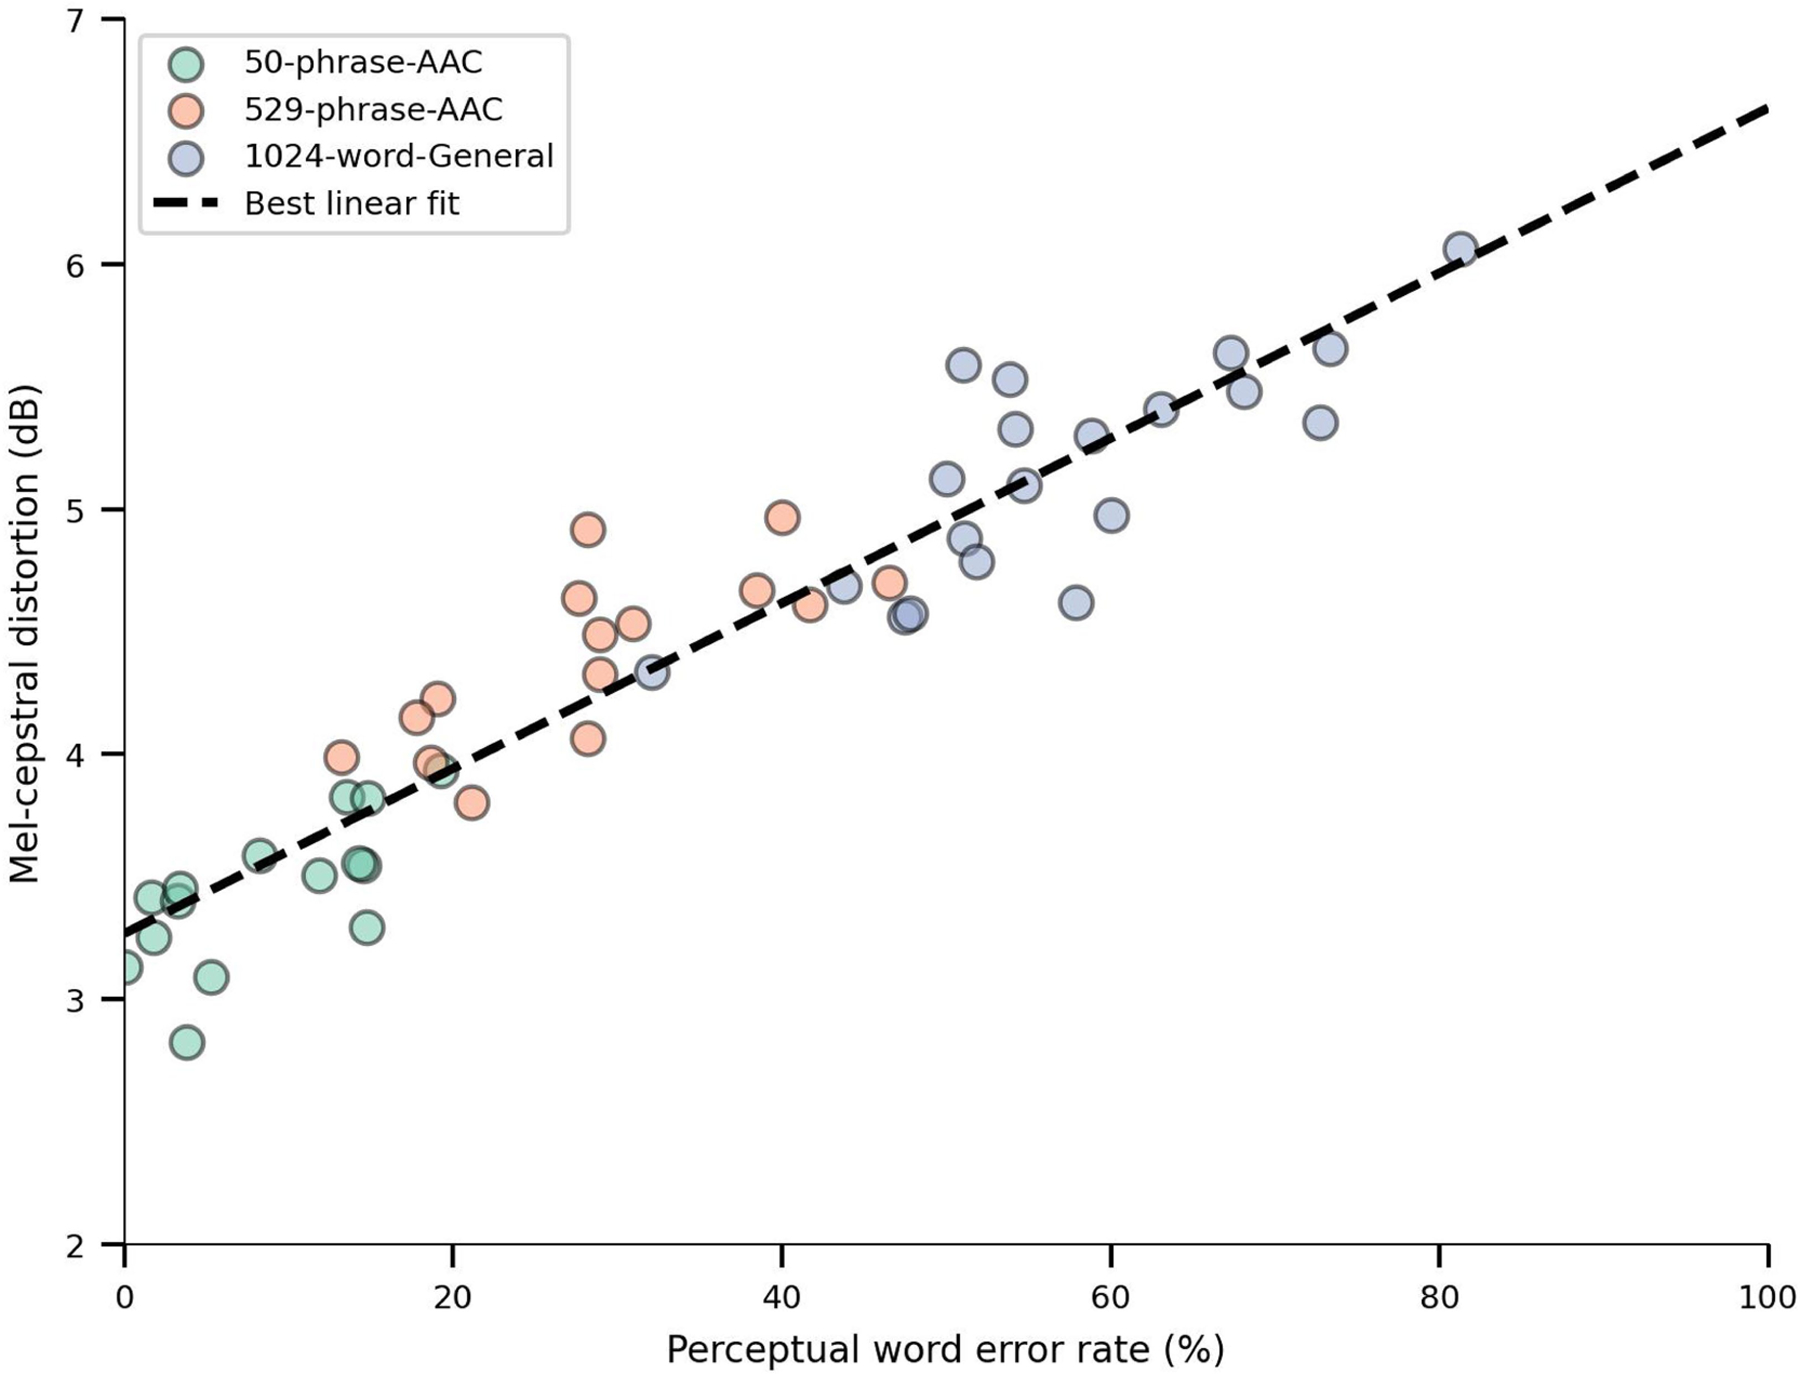
Extended Data Fig. 6 |. Comparison of perceptual word error rate and mel-cepstral distortion.

Scatter plot illustrating relationship between perceptual word error rate (WER) and mel-cepstral distortion (MCD) for the 50-phraseAAC sentence set, the 529-phrase-AAC sentence set, the 1024-word-General sentence set. Each data point represents the mean accuracy from a single pseudo-block. A dashed black line indicates the best linear fit to the pseudo-blocks, providing a visual representation of the overall trend. Consistent with expectation, this plot suggests a positive correlation between WER and MCD for our speech synthesizer.
