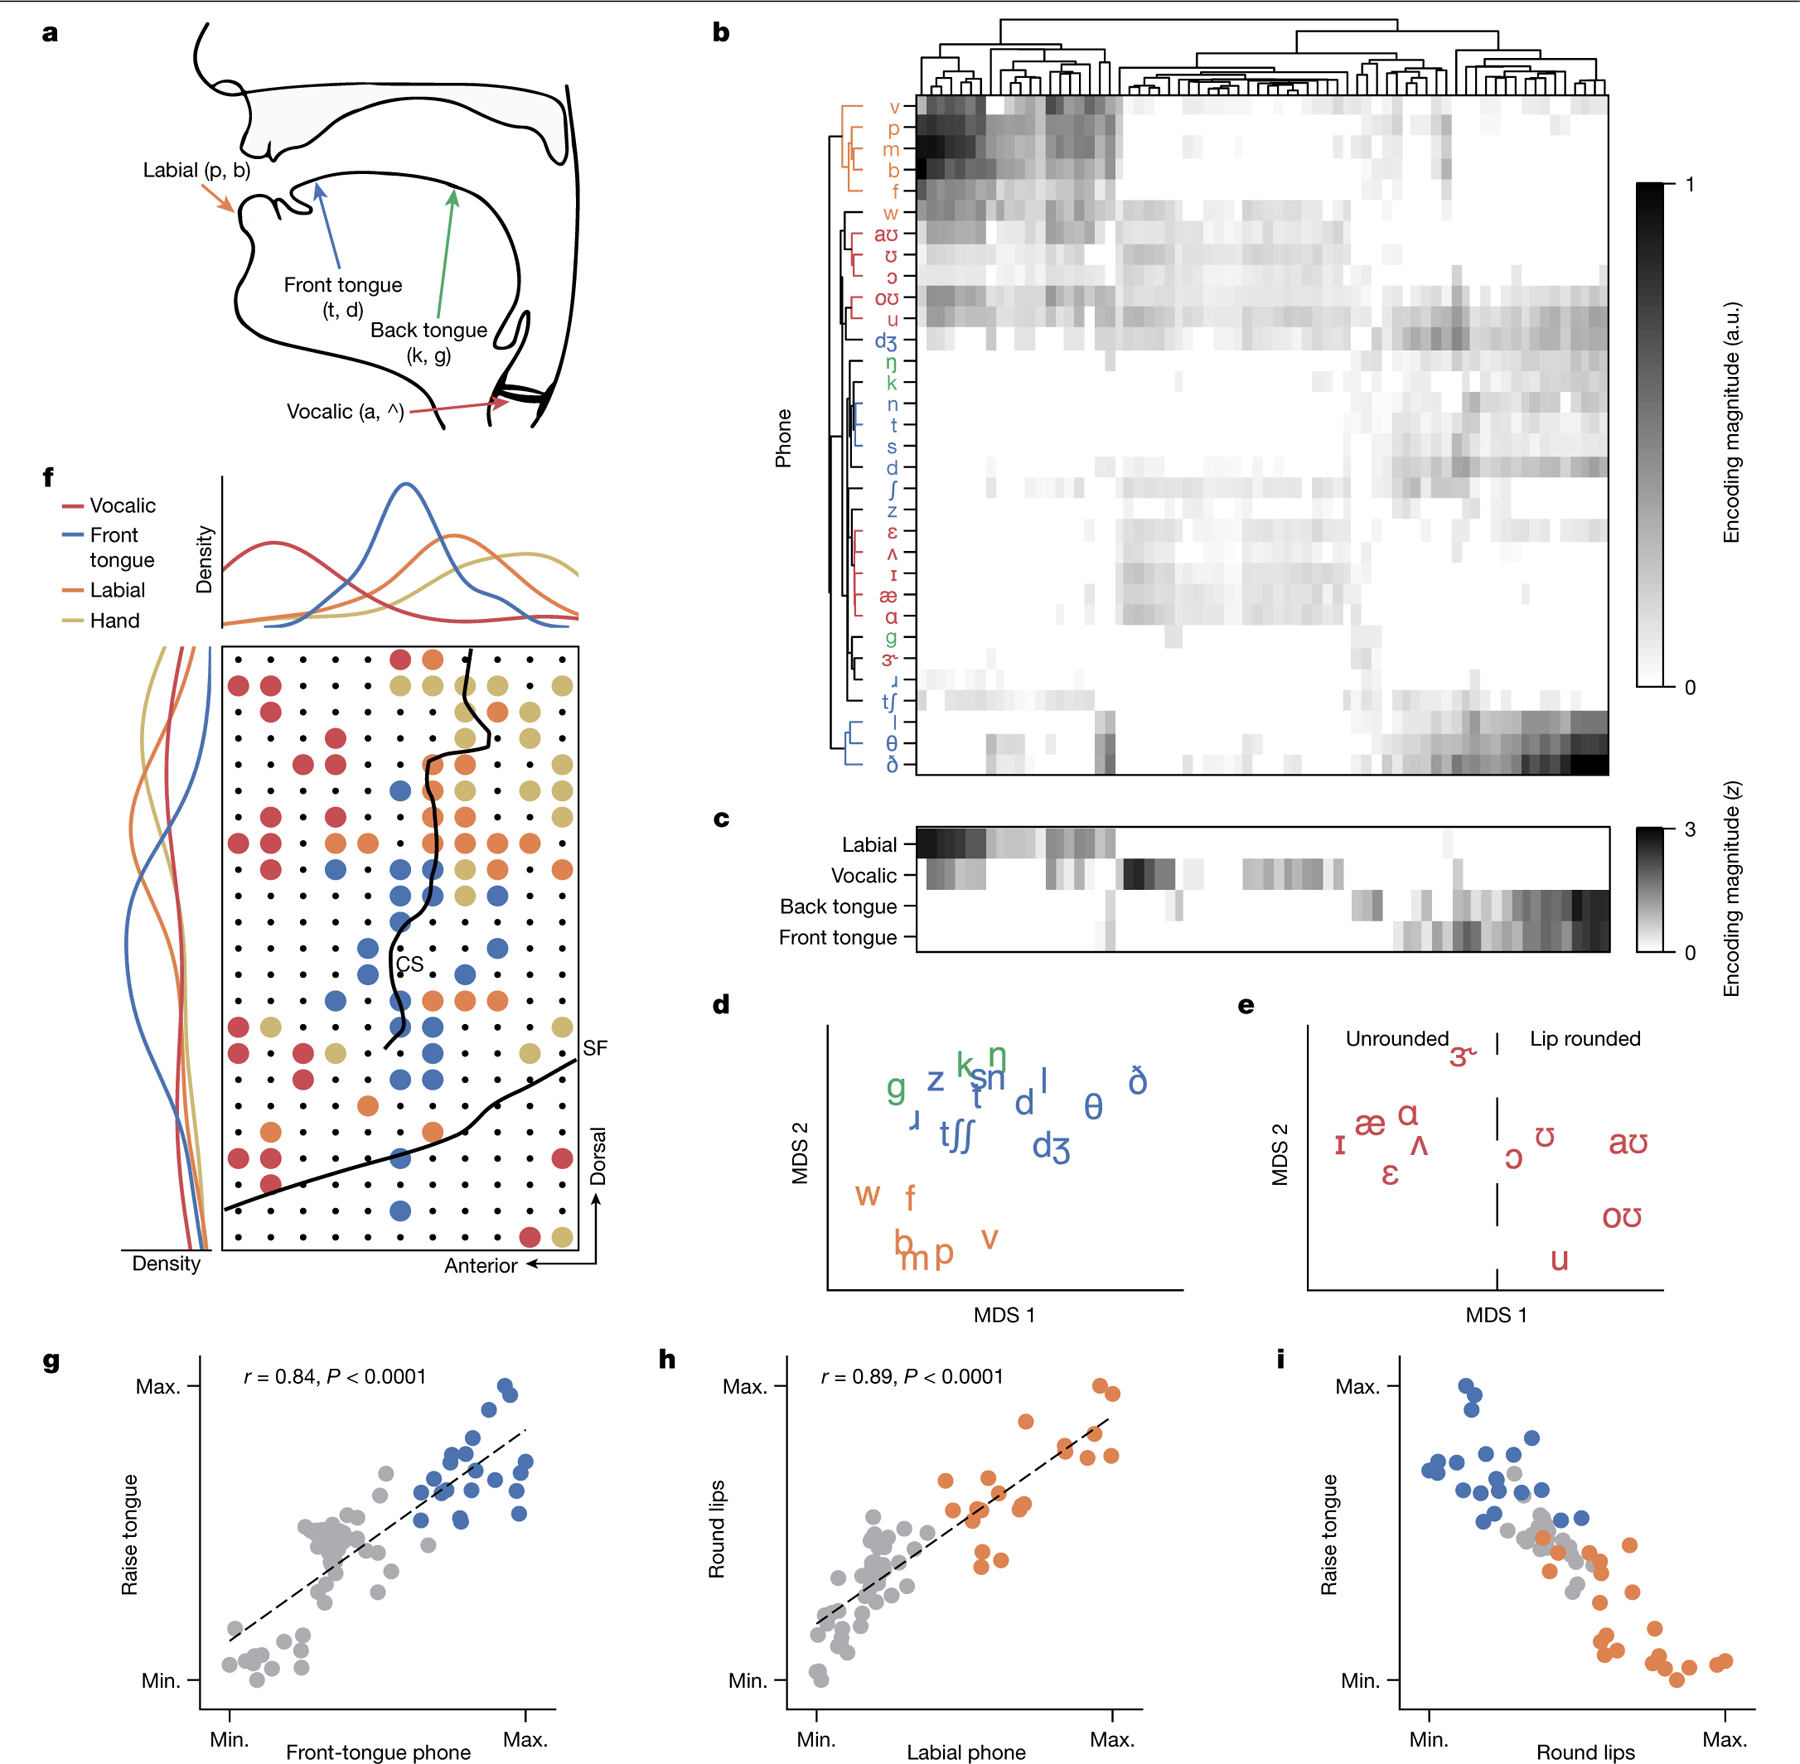
Fig. 5 |. Articulatory encodings driving speech decoding.

a, Mid-sagittal schematic of the vocal tract with phone POA features labelled. b, Phone-encoding vectors for each electrode computed by a temporal receptive-field model on neural activity recorded during attempts to silently say sentences from the 1024-word-General set, organized by unsupervised hierarchical clustering. a.u., arbitrary units. c, z-scored POA encodings for each electrode, computed by averaging across positive phone encodings within each POA category. z values are clipped at 0. d,e, Projection of consonant (d) and vowel (e) phone encodings into a 2D space using multidimensional scaling (MDS). f, Bottom right: visualization of the locations of electrodes with the greatest encoding weights for labial, front-tongue and vocalic phones on the ECoG array. The electrodes that most strongly encoded finger flexion during the NATO-motor task are also included. Only the top 30% of electrodes within each condition are shown, and the strongest tuning was used for categorization if an electrode was in the top 30% for multiple conditions. Black lines denote the central sulcus (CS) and Sylvian fissure (SF). Top and left: the spatial electrode distributions for each condition along the anterior–posterior and ventral–dorsal axes, respectively. g–i, Electrode-tuning comparisons between front-tongue phone encoding and tongue-raising attempts (g; r = 0.84, P < 0.0001, ordinary least-squares regression), labial phone encoding and lip-puckering attempts (h; r = 0.89, P < 0.0001, ordinary least-squares regression) and tongue-raising and lip-rounding attempts (i). Non-phonetic tunings were computed from neural activations during the articulatory-movement task. Each plot depicts the same electrodes encoding front-tongue and labial phones (from f) as blue and orange dots, respectively; all other electrodes are shown as grey dots. Max., maximum; min., minimum.
