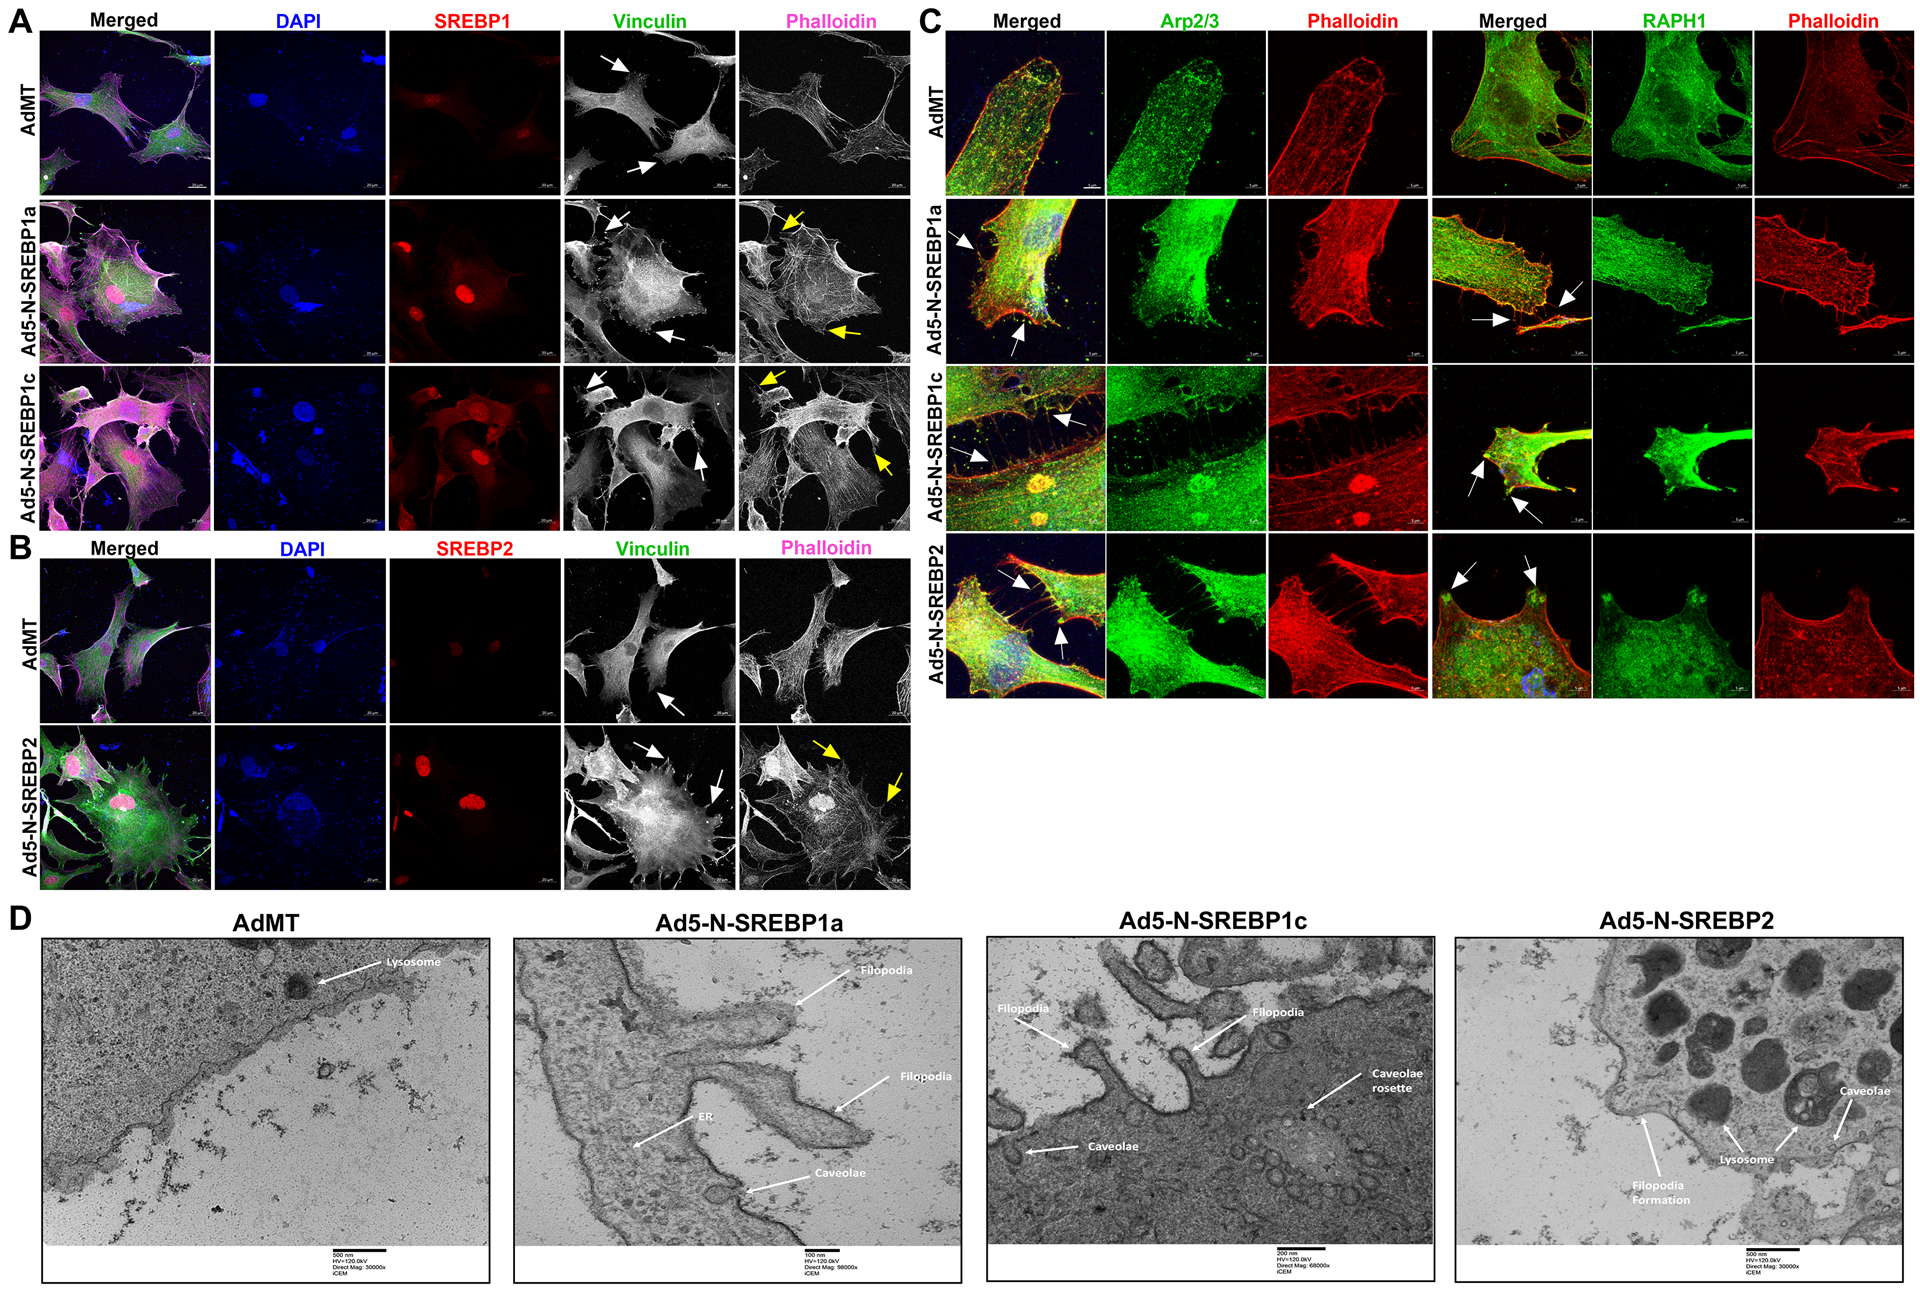
Fig. 2: Constitutive induction of SREBPs activation modulates actin and focal adhesion dynamics.

(A) and (B) Immunofluorescence (IF) shows the distribution of SREBP1, SREBP2, filamentous actin (F-actin) fibers, and vinculin in HTM cells under AdMT and Ad5-N-SREBPs treatments. (A) Ad5-N-SREBP1a (second-row third column), and Ad5-N-SREBP1c (third-row third column) induced strong staining of SREBP1 in the nucleus in HTM cells compared to AdMT (first-row third column). Similarly, (B) Ad5-N-SREBP2 (second-row third column) induced strong staining of SREBP2 in the nucleus in HTM cells compared to AdMT (first-row third column). Compared to AdMT (first-row fifth column), (A) Ad5-N-SREBP1a (second-row fifth column) and Ad5-N-SREBP1c (third-row fifth column), and (B) Ad5-N-SREBP2 (second-row fifth column) caused the increased distribution of F-actin fibers stained by phalloidin (purple/grayscale) in HTM cells and induced increased lamellipodia and filopodia formation (indicated by yellow arrows). (A) Ad5-N-SREBP1a (second-row fourth column), Ad5-N-SREBP1c (third-row fourth column), and (B) Ad5-N-SREBP2 (second-row fourth column) also induced more distribution of vinculin (green/grayscale) at the edges of F-actin fibers (indicated by white arrows) in HTM cells compared to the AdMT (first-row fourth column). The nucleus was stained with DAPI in blue. Images were captured in z-stack in a confocal microscope, and stacks were orthogonally projected. Scale bar 20 micron. (C) Immunofluorescence (IF) shows the distribution of Arp2/3 and RAPH1 in HTM cells under AdMT and Ad5-N-SREBPs treatment. Compared to AdMT, Ad5-N-SREBPs induced the distribution of Arp2/3 and RAPH1 at the cell membrane and near the filopodia structures. Images were captured in z-stack in a confocal microscope, and stacks were orthogonally projected. Scale bar 5 micron. (D) Transmission electron microscope (TEM) image of HTM cells under AdMT and Ad5-N-SREBPs treatment. Compared to AdMT, Ad5-N-SREBP1a, Ad5-N-SREBP1c, and Ad5-N-SREBP2 induced membrane bending and filopodia formation. Scale bar as shown in the figure.
