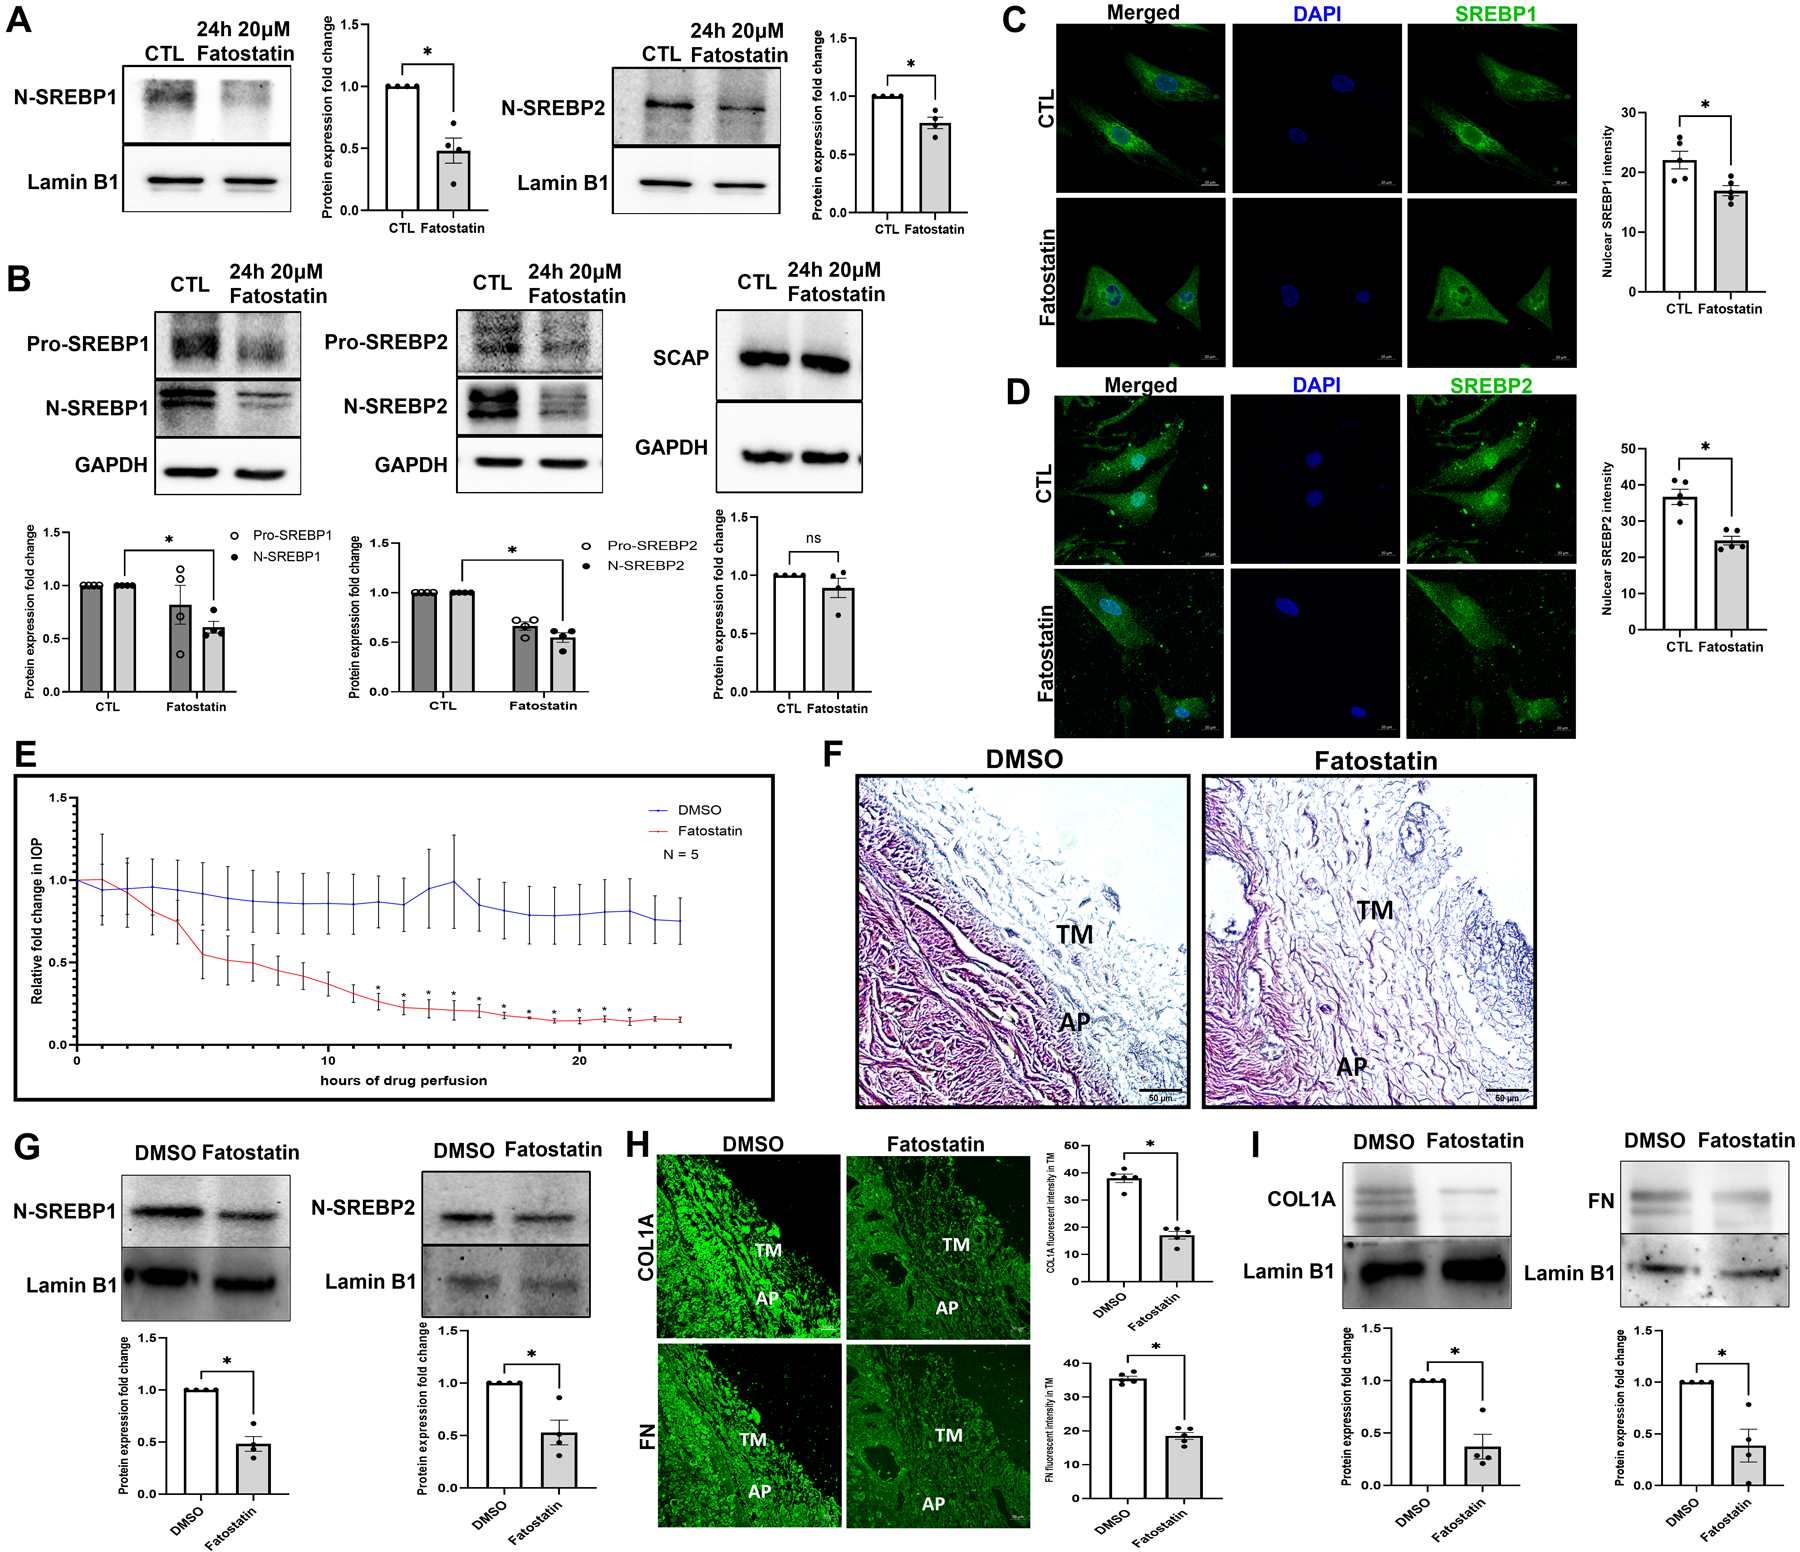
Fig. 3: Pharmacological inhibition of SCAP-SREBP pathway lowers IOP.

(A) Nuclear fraction from PTM cells after 20 μM fatostatin for 24 h treatment. Immunoblotting result shows that both N-SREBP1 (left panel) and N-SREBP2 (right panel) were significantly decreased. Lamin B1 was used as a loading control. (B) Primary HTM cells were treated with 20 μM fatostatin for 24 h, and immunoblotting results show that both N-SREBP1 (left panel) and N-SREBP2 (middle panel) were significantly decreased under fatostatin treatment, but SCAP protein expression level was not significantly different in two groups (right panel). GAPDH was used as a loading control. (C) and (D) Immunofluorescence (IF) shows the changes in SREBP1 and SREBP2 distribution in HTM cells after 20 μM fatostatin treatment (left panel). In the fatostatin treated HTM cells, less SREBP1 (green staining) and SREBP2 (green staining) were distributed inside the nucleus (second row), compared to DMSO treated control HTM cells (first row). The nucleus was stained with DAPI in blue. Images were captured in z-stack in a confocal microscope, and stacks were orthogonally projected. Scale bar 20 microns. Quantification of immunofluorescence images using ImageJ-based fluorescence intensity measurements shows a significant decrease in both nuclear SREBP1 and nuclear SREBP2 mean fluorescence intensity in fatostatin treated HTM cells (right panel). Freshly enucleated porcine eyes were perfused with 20 μM fatostatin or DMSO control after baseline was established with perfusion media containing D-glucose at 37 °C. (E) Graphical representation of relative fold change in IOP showed a significant decrease post 12 h of fatostatin perfusion (red line) and remained significant until 22 h compared to vehicle DMSO perfused control (blue line). (F) Histological examination of the outflow pathway tissues using Hematoxylin and Eosin (H and E) staining showed increased spacing between the TM in the fatostatin perfused eyes compared to a more compact TM in the DMSO perfused eyes. Scale bar 50 micron. (G) Quantitative analysis of protein expression from 20 μM fatostatin perfused TM tissues showed a significant decrease in N-SREBP1 and N-SREBP2, compared to vehicle DMSO perfused control. Lamin B1 was used as a loading control. (H) Immunolocalization of ECM proteins, including COL1A and FN (green staining) in the outflow pathway tissue in DMSO control or fatostatin. In the fatostatin perfused eyes, COL1A and FN (left panel second column) showed a decreased distribution in the TM-JCT region. TM indicates trabecular meshwork. AP indicates aqueous plexus. Images were captured in z-stack in a confocal microscope, and stacks were orthogonally projected. Scale bar 50 micron. Quantification of immunofluorescence images using ImageJ-based fluorescence intensity measurements showed a significant decrease in the fluorescence intensity of COL1A and FN in the TM outflow pathway (right panel). (I) Quantitative analysis of protein expression from 20 μM fatostatin perfused TM tissues showed a significant decrease in COL1A, and FN compared to vehicle DMSO perfused control. Lamin B1 was used as a loading control. Values represent the mean ± SEM, where n = 4–5 (biological replicates). *p < 0.05 was considered statistically significant.
