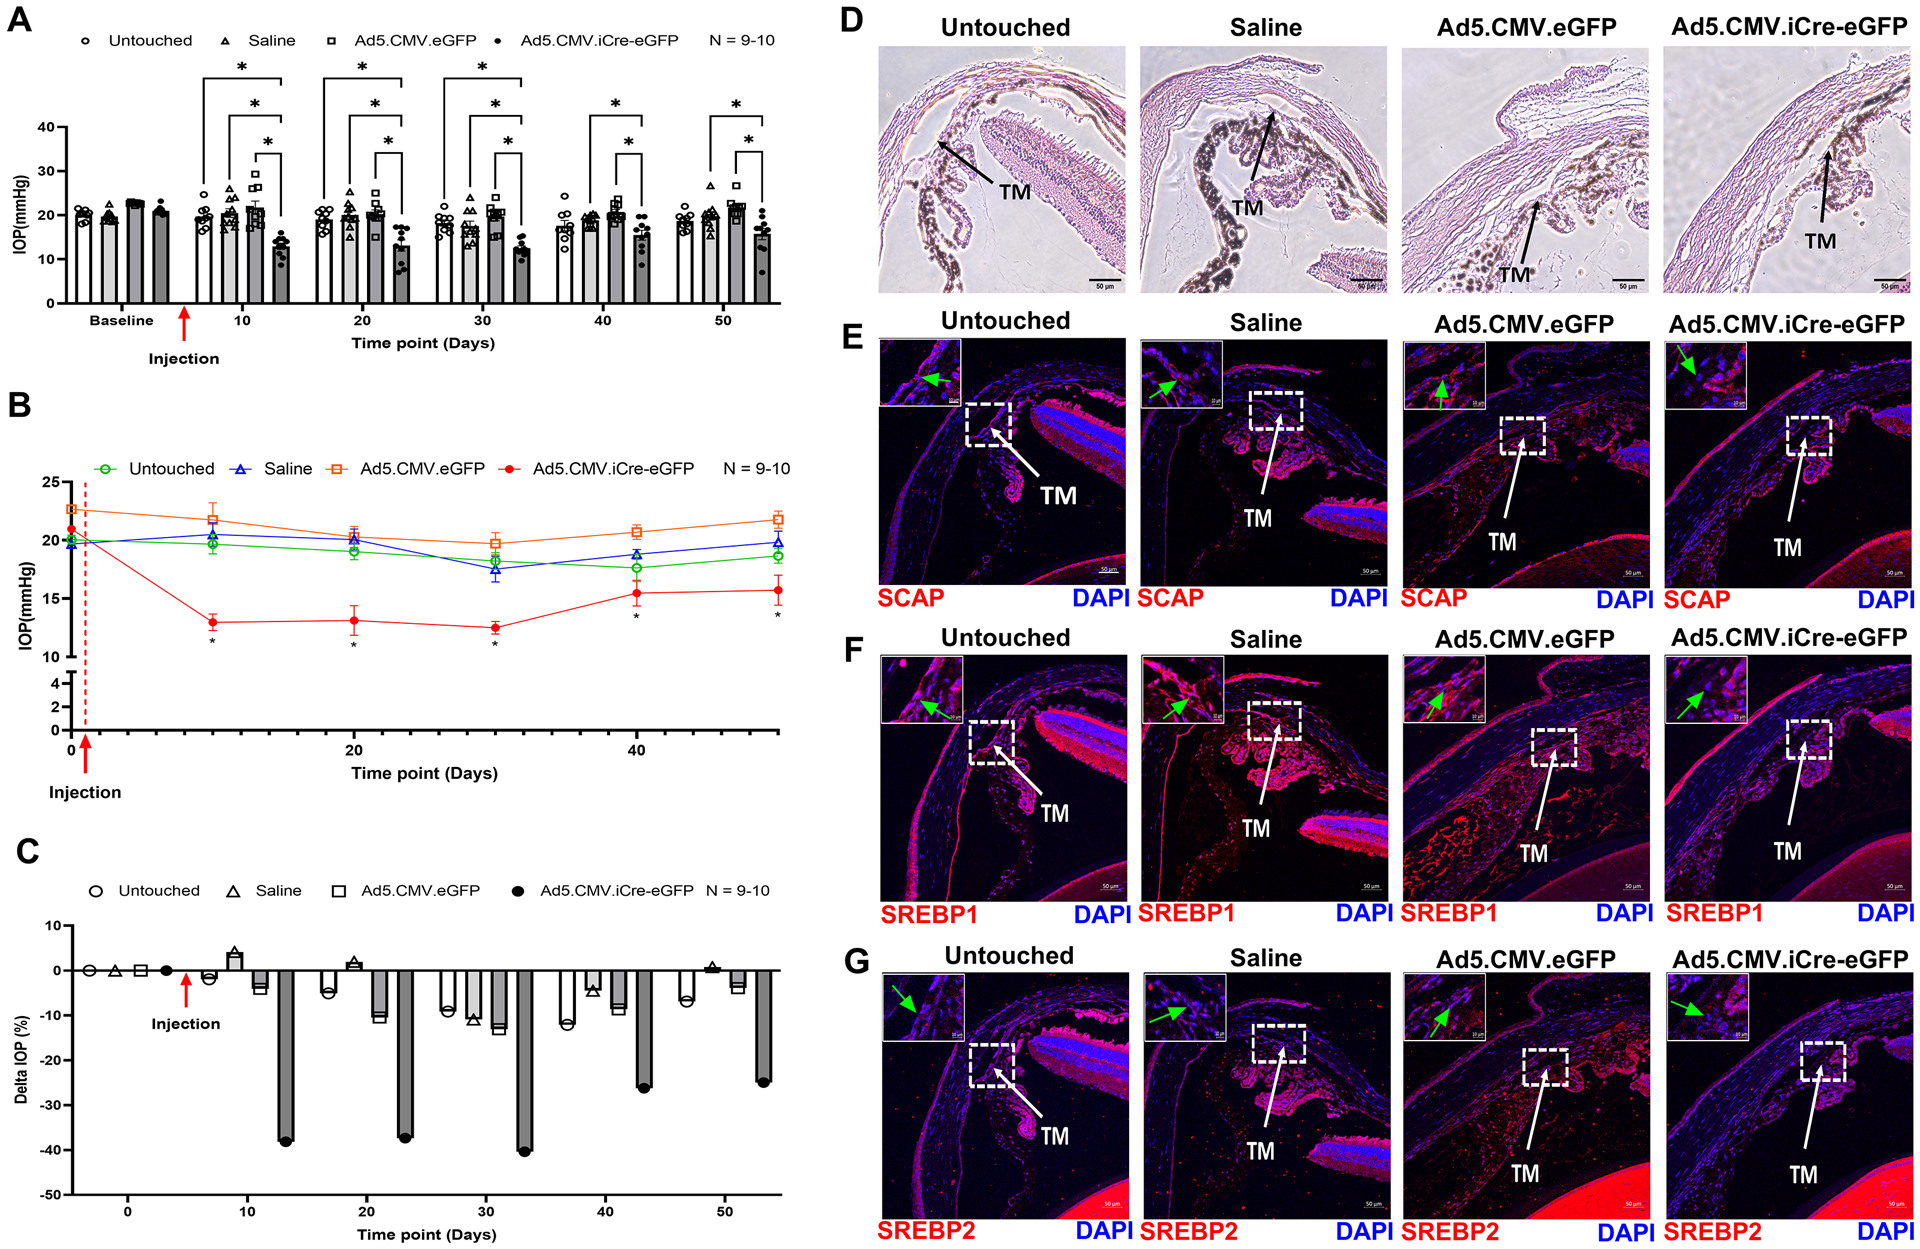
Fig. 4: Molecular inactivation of SREBPs by SCAP knockdown lowers IOP.

(A) Starting from 10 days after saline and adenovirus injection, IOP was significantly decreased in Ad5.CMV.iCre-eGFP injection group compared to the untouched group, saline injection group, and Ad5.CMV.eGFP injection group. This significant reduction in IOP in Ad5.CMV.iCre-eGFP injection group was sustained until 30 days post-injection. On 40 days and 50 days post-injection, compared to saline injection group and Ad5.CMV.eGFP injection group, IOP in Ad5.CMV.iCre-eGFP injection group was significantly decreased, it was also lower than the untouched group, but not statistically significant. (B) IOP changes in each group were analyzed and compared to their baseline normal IOP (before injection/time point 0 days), the graphical representation shows that IOP was significantly decreased in Ad5.CMV.iCre-eGFP injection group starting from 10 days after injection and sustained until 50 days post-injection. There were no significant changes in IOP levels in other control groups. (C) IOP percentage change (Delta IOP) compared to their baseline normal IOP in each group was calculated, and a graphical representation shows that IOP in Ad5.CMV.iCre-eGFP injection group was decreased as much as 40.38 % of baseline normal (before injection/time point 0 days) with an average decrease of 27.85 %. The IOP in other control groups showed less than 13 % changes of baseline normal IOP. (D) Histological examination of the TM using Hematoxylin and Eosin (H and E) staining showed no gross morphological alterations between four groups. Scale bar 50 micron. (E), (F) and (G) Immunolocalization of SCAP, SREBP1 and SREBP2 proteins in TM in four groups. SCAP showed decreased distribution in TM in Ad5.CMV.iCre-eGFP injection group compared to all other sham control groups. SREBP1 and SREBP2 showed decreased distribution in the nuclear regions in TM in Ad5.CMV.iCre-eGFP injection group compared to other sham control groups. TM indicates trabecular meshwork and marked by white color arrow. Images were captured in z-stack in a confocal microscope, and stacks were orthogonally projected. Scale bar 50 micron. The top left corner in each image shows the magnification of the framed area showing the nuclear regions in TM and marked by green color arrow. Scale bar 10 micron. Values represent the mean ± SEM, where n = 9–10 (biological replicates). *p < 0.05 was considered statistically significant.
