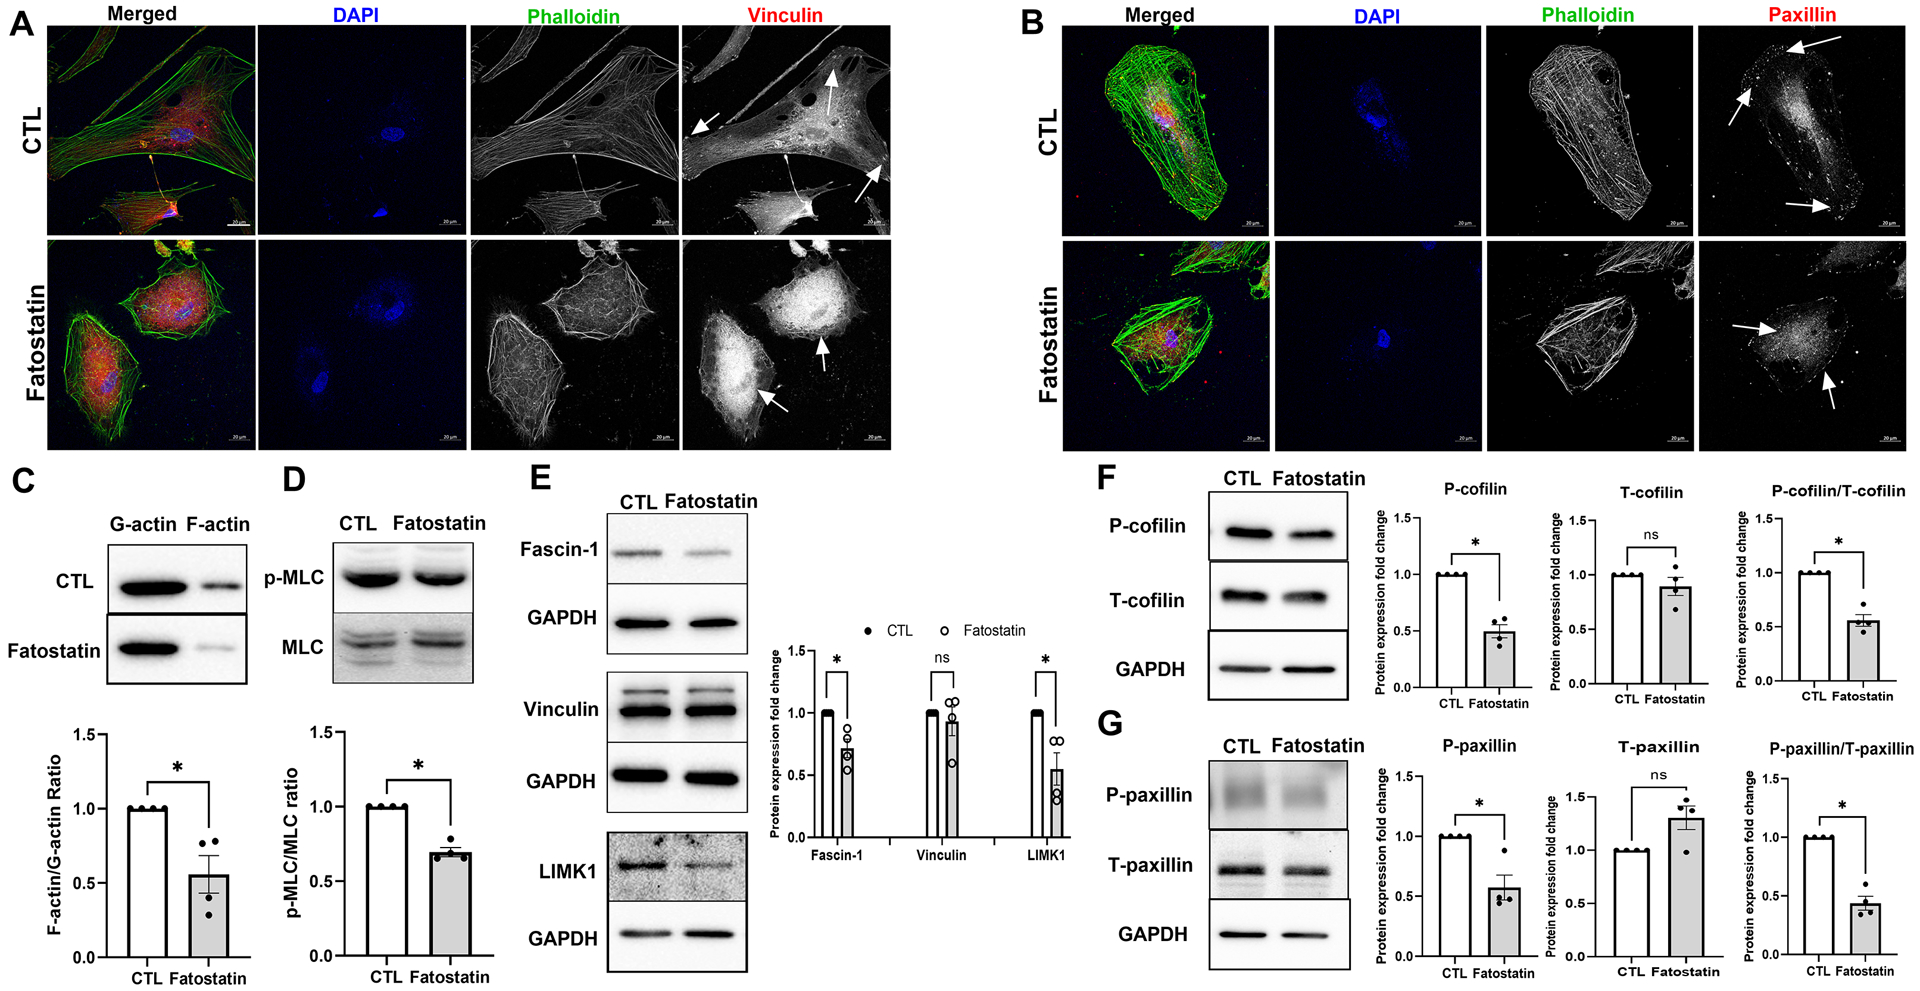
Fig. 6: SREBPs inactivation hampers actin polymerization machinery and disengages focal adhesions.

(A) and (B) Immunofluorescence (IF) shows the distribution of filamentous actin (F-actin) fiber, vinculin, and paxillin distribution in HTM cells under DMSO and fatostatin treatment. Fatostatin caused the reduced distribution of F-actin fiber stained by phalloidin (green/grayscale) in HTM cells (first and third column) compared to the control. Fatostatin treatment resulted in less distribution of vinculin (red/grayscale) and paxillin (red/grayscale) at the edges of F-actin fiber, but more cytoplasmic distribution (indicated by white arrows) in HTM cells (first and fourth column) compared to the control. The nucleus was stained with DAPI in blue. Images were captured in z-stack in a confocal microscope, and stacks were orthogonally projected. Scale bar 20 micron. (C) Globular actin (G-actin) and F-actin were extracted from HTM cells treated with DMSO or fatostatin. Immunoblotting shows that fatostatin significantly decreased F-actin/G-actin ratio in HTM cells compared to the control. (D) Immunoblotting shows that fatostatin treatment significantly decreased p-MLC/MLC ratio in HTM cells. (E) Immunoblotting shows that fatostatin treatment significantly reduced Fascin-1 and LIMK1 protein expression, but no difference in vinculin expression compared to the control. GAPDH was used as a loading control. (F) Immunoblotting shows that there was no significant difference in total-cofilin (T-cofilin) protein expression levels in DMSO and fatostatin treated HTM cells. The phospho-cofilin (P-cofilin) and the ratio of P-cofilin/T-cofilin were significantly decreased in fatostatin treated HTM cells compared to the control. GAPDH was used as a loading control. (G) Immunoblotting shows that fatostatin significantly decreased phospho-paxillin (P-paxillin) protein expression level, increased total-paxillin (T-paxillin) protein expression level, and significantly reduced the ratio of P-paxillin/T-paxillin compared to the control. GAPDH was used as a loading control. Values represent the mean ± SEM, where n = 4 (biological replicates). *p < 0.05 was considered statistically significant, and ns denotes non-significant.
