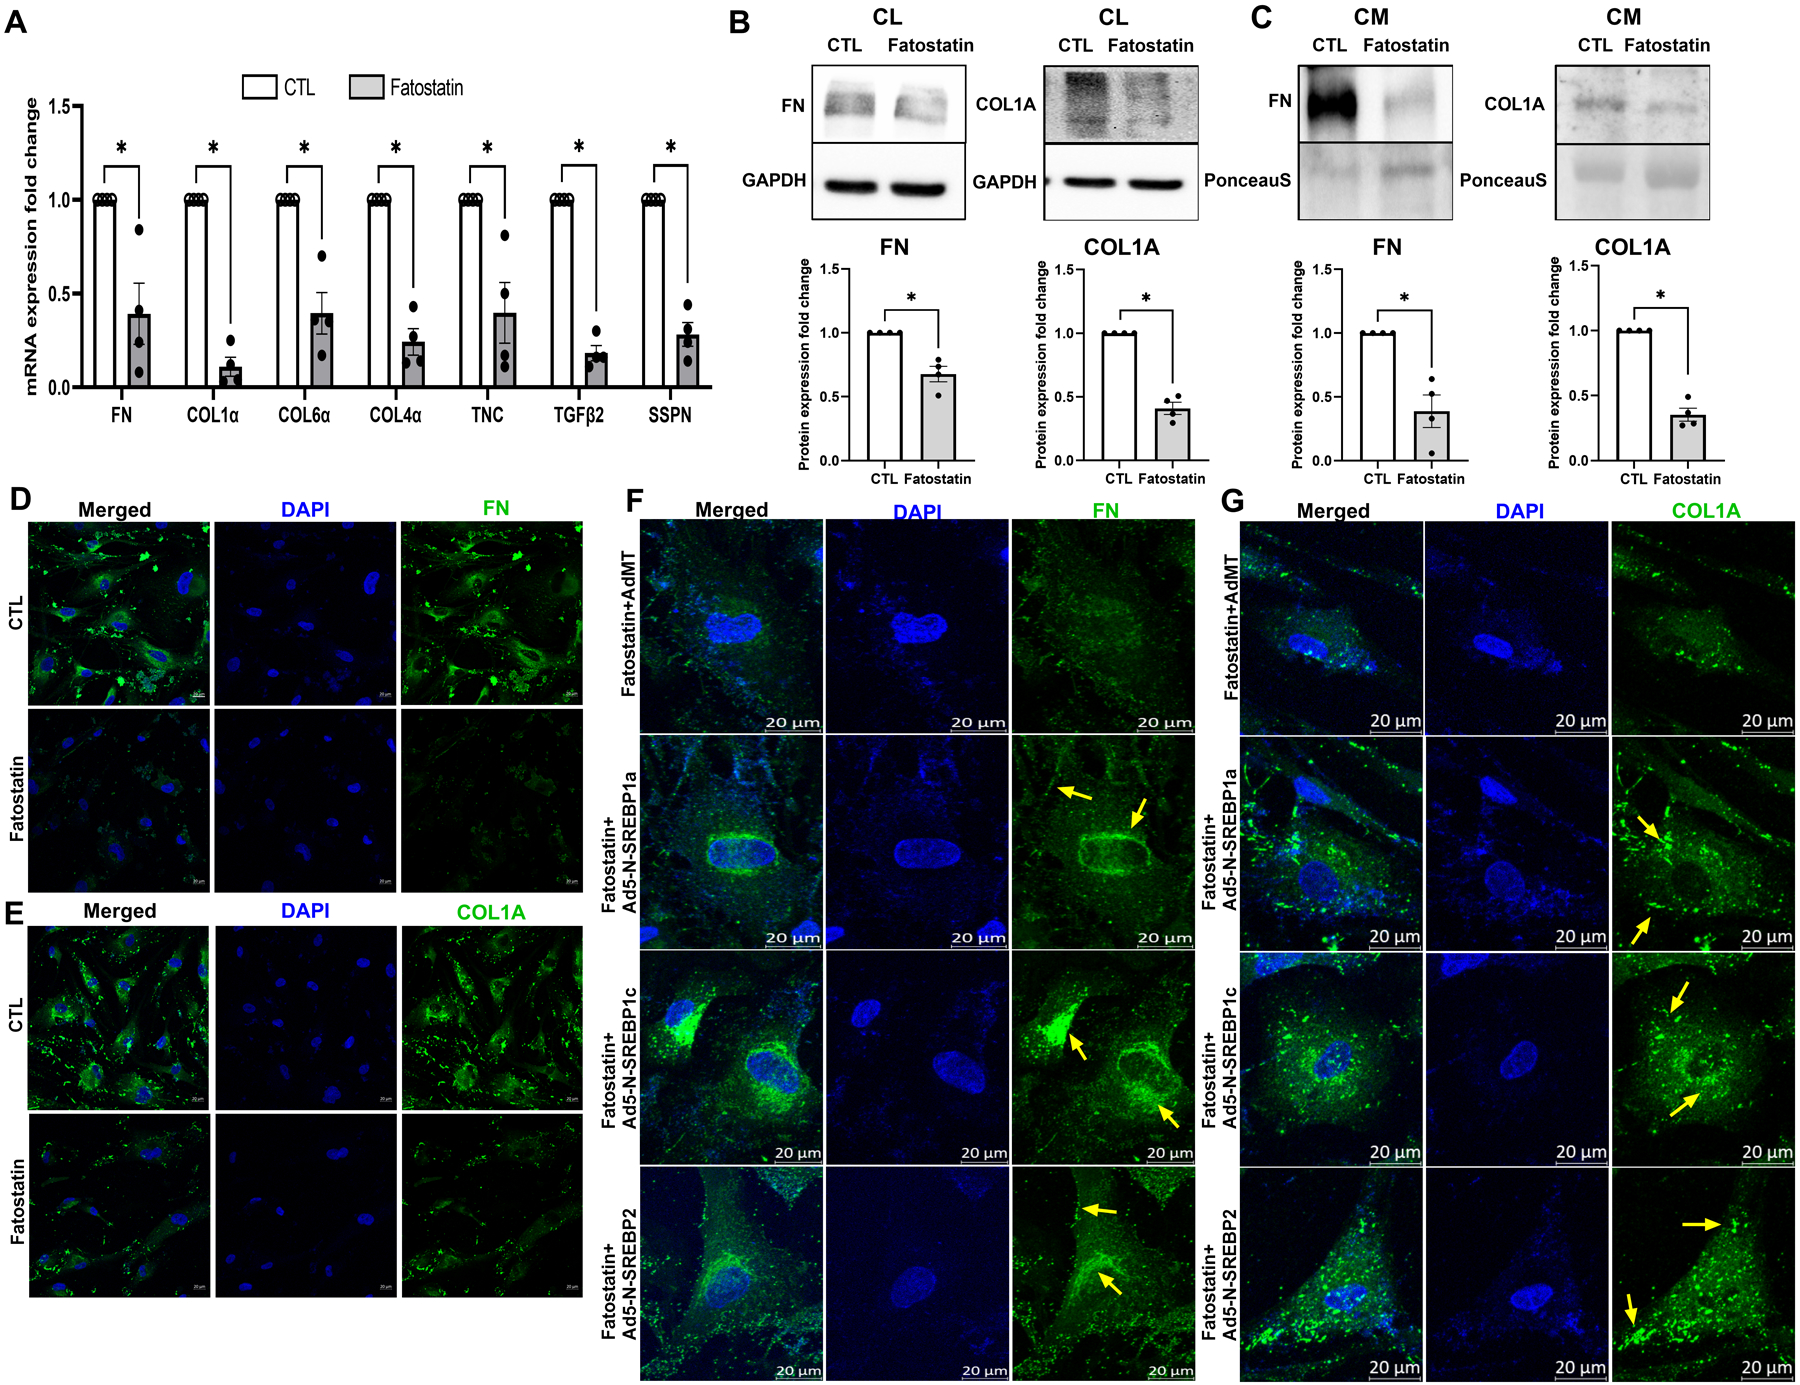
Fig. 7: SREBP activation is a critical regulator of ECM engagement to the matrix sites.

(A) Regulation of ECM mRNA expression under fatostatin treatment. Fatostatin treatment significantly decreased mRNA expression in fibronectin (FN), collagen 1 (COL1), collagen 6 (COL6), collagen 4 (COL4), tenascin C (TNC), transforming growth factor β2 (TGFβ2), and sarcospan (SSPN) in HTM cells compared to DMSO treated control HTM cells. (B) Immunoblotting for whole cell lysate (CL) shows that fatostatin significantly decreased FN, and COL1A protein expression compared to DMSO treated control HTM cells. GAPDH was used as a loading control. (C) Immunoblotting for conditioned media (CM) shows that fatostatin significantly decreased FN and COL1A protein expression in HTM CM compared to DMSO treated control HTM CM. Ponceau S was used as a loading control. (D) and (E) Immunofluorescence (IF) shows the FN and COL1A expression and distribution in HTM cells after DMSO or fatostatin treatment. Fatostatin reduced FN (green staining) and COL1A (green staining) distribution compared to the control. The nucleus was stained with DAPI in blue. (F) and (G) Immunofluorescence (IF) shows that compared to fatostatin combined with AdMT treatment (first-row third column), there was increased FN and COL1A expression and distribution in HTM cells in fatostatin combined with Ad5-N-SREBP1a (second-row third column), Ad5-N-SREBP1c (third-row third column) and Ad5-N-SREBP2 (fourth-row third column) treatments. The nucleus was stained with DAPI in blue. Images were captured in z-stack in a confocal microscope, and stacks were orthogonally projected. Scale bar 20 micron. The lower magnification images of the cells can be visualized in the Supplementary Figure 7. Values represent the mean ± SEM, where n = 4 (biological replicates). *p < 0.05 was considered statistically significant.
