Figure 3.

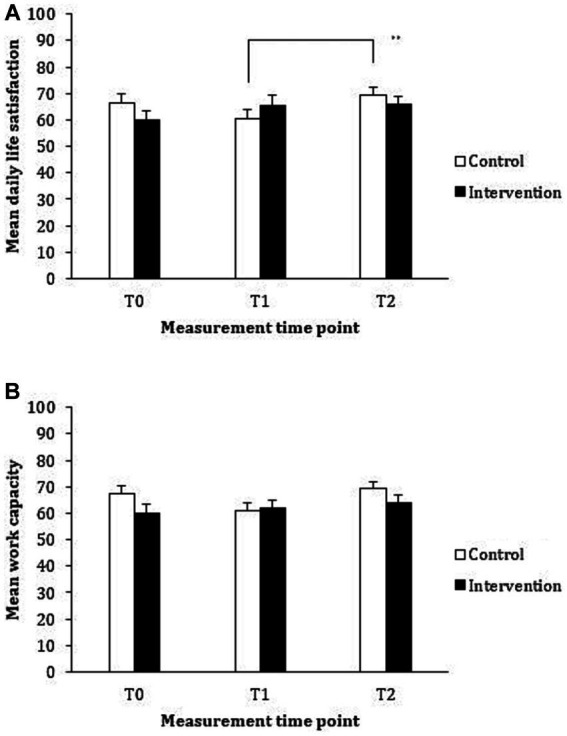
Mean reported daily life satisfaction (A) and work capacity (B) for the control (waiting list) and intervention (vitality training) groups at baseline (T0), immediately following (T1), and at 3 months following the intervention (T2).

Mean reported daily life satisfaction (A) and work capacity (B) for the control (waiting list) and intervention (vitality training) groups at baseline (T0), immediately following (T1), and at 3 months following the intervention (T2).