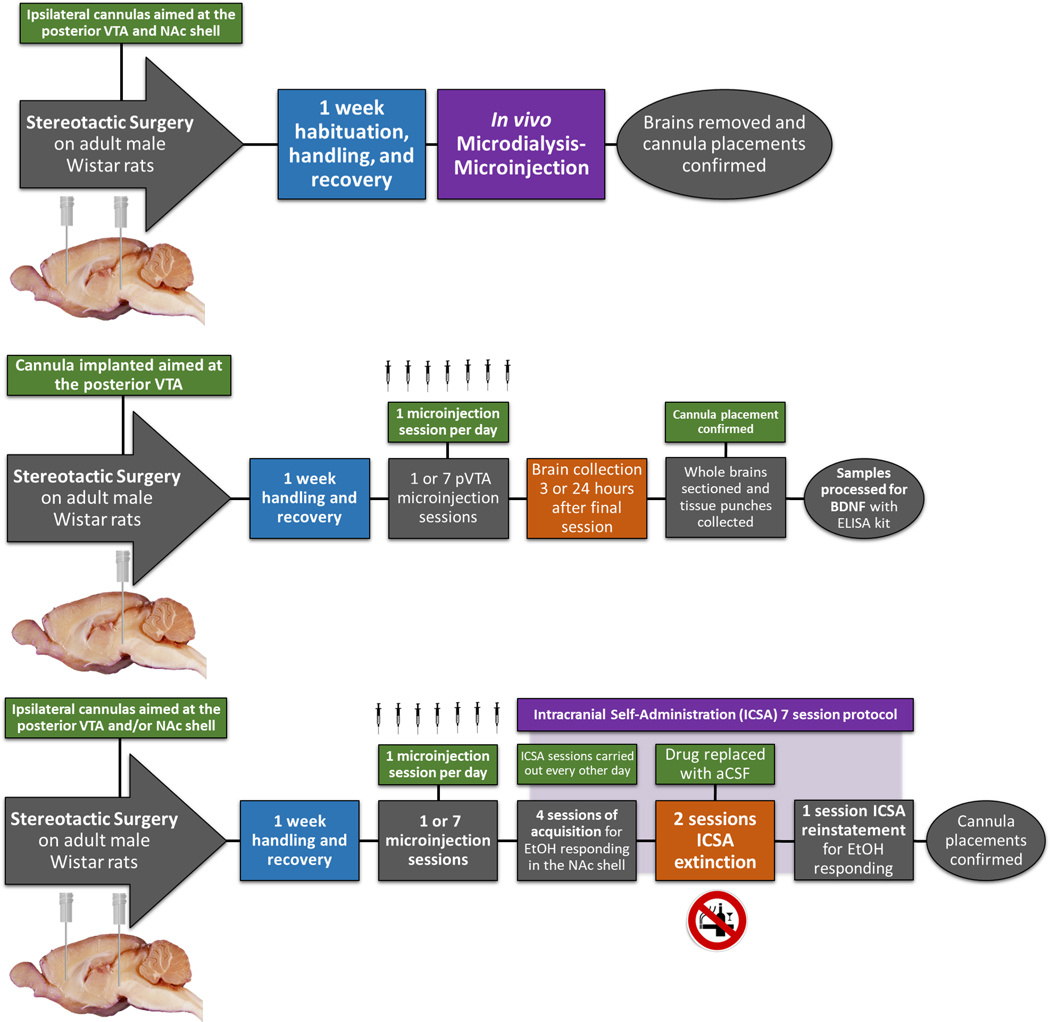
Figure 1.
Illustration of experimental timelines (n = 351). Top panel: Experimental timeline (n = 57) which investigated the effect of 1 (acute) intra-pVTA microinjection sessions on NAc shell dopamine (n = 7–10 animals/group) and glutamate (n = 6–10 animals/group) levels. Treatment groups included aCSF control, 100 mg% EtOH, 150 mg% EtOH, 10 μM NIC, 50 μM NIC, 100 mg% EtOH+10 μM NIC, or 150 mg% EtOH+50 μM NIC. Middle panel: Experimental timeline which investigated the effect of 1 (acute) or 7 (repeated) intra-pVTA microinjection sessions on NAc shell BDNF protein levels (n = 77). Treatment groups included aCSF control, 100 mg% EtOH, 150 mg% EtOH, 10 μM NIC, 50 μM NIC, 100 mg% EtOH+10 μM NIC, or 150 mg% EtOH+50 μM NIC (n = 4–8 animals/group). Bottom panel: Experimental timeline (n = 166) to determine the effects of repeated microinjection sessions of aCSF control, 100 mg% EtOH, 10 μM NIC, 100 mg% EtOH+10 μM NIC, or 0.125 μg BDNF on EtOH reward in the NAc shell (n = 4–8 animals/group). Some animals were excluded for cannula placements outside the region of interest (n = 46) or technical complications (n = 5) during sample collection.

