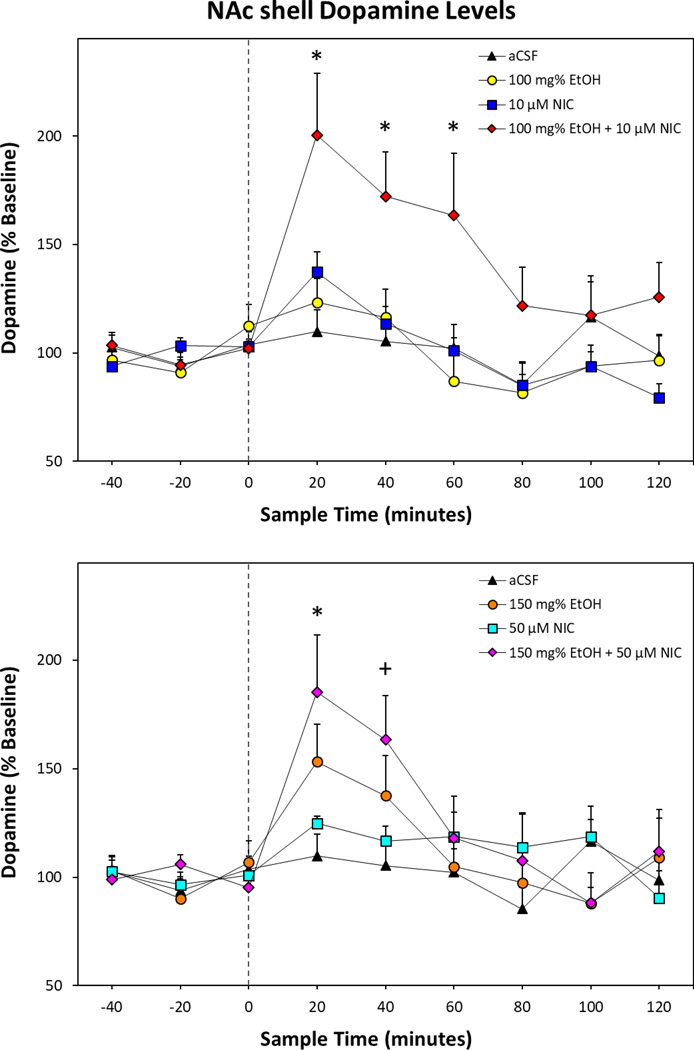
Figure 2.
Depicts the mean (+SEM) percent change in dopamine levels (n = 7–10 animals/group) within the NAc shell of rats receiving intra-pVTA infusions of EtOH and/or NIC. Top Panel: Mean (+SEM) dopamine levels for aCSF control, 100 mg% EtOH, 10 μM NIC, and 100 mg% EtOH+10 μM NIC. Bottom Panel: Mean (+SEM) dopamine levels for aCSF control, 150 mg% EtOH, 50 μM NIC, and 150 mg% EtOH+50 μM NIC. Treatment groups were analyzed together but presented separately for clarity. Asterisk (*) indicates significantly elevated dopamine levels in both EtOH+NIC treated groups compared to aCSF controls. Plus sign (+) indicates 150 mg% EtOH+50 μM NIC and 150 mg% EtOH treatment groups were significantly higher than respective baseline levels.

