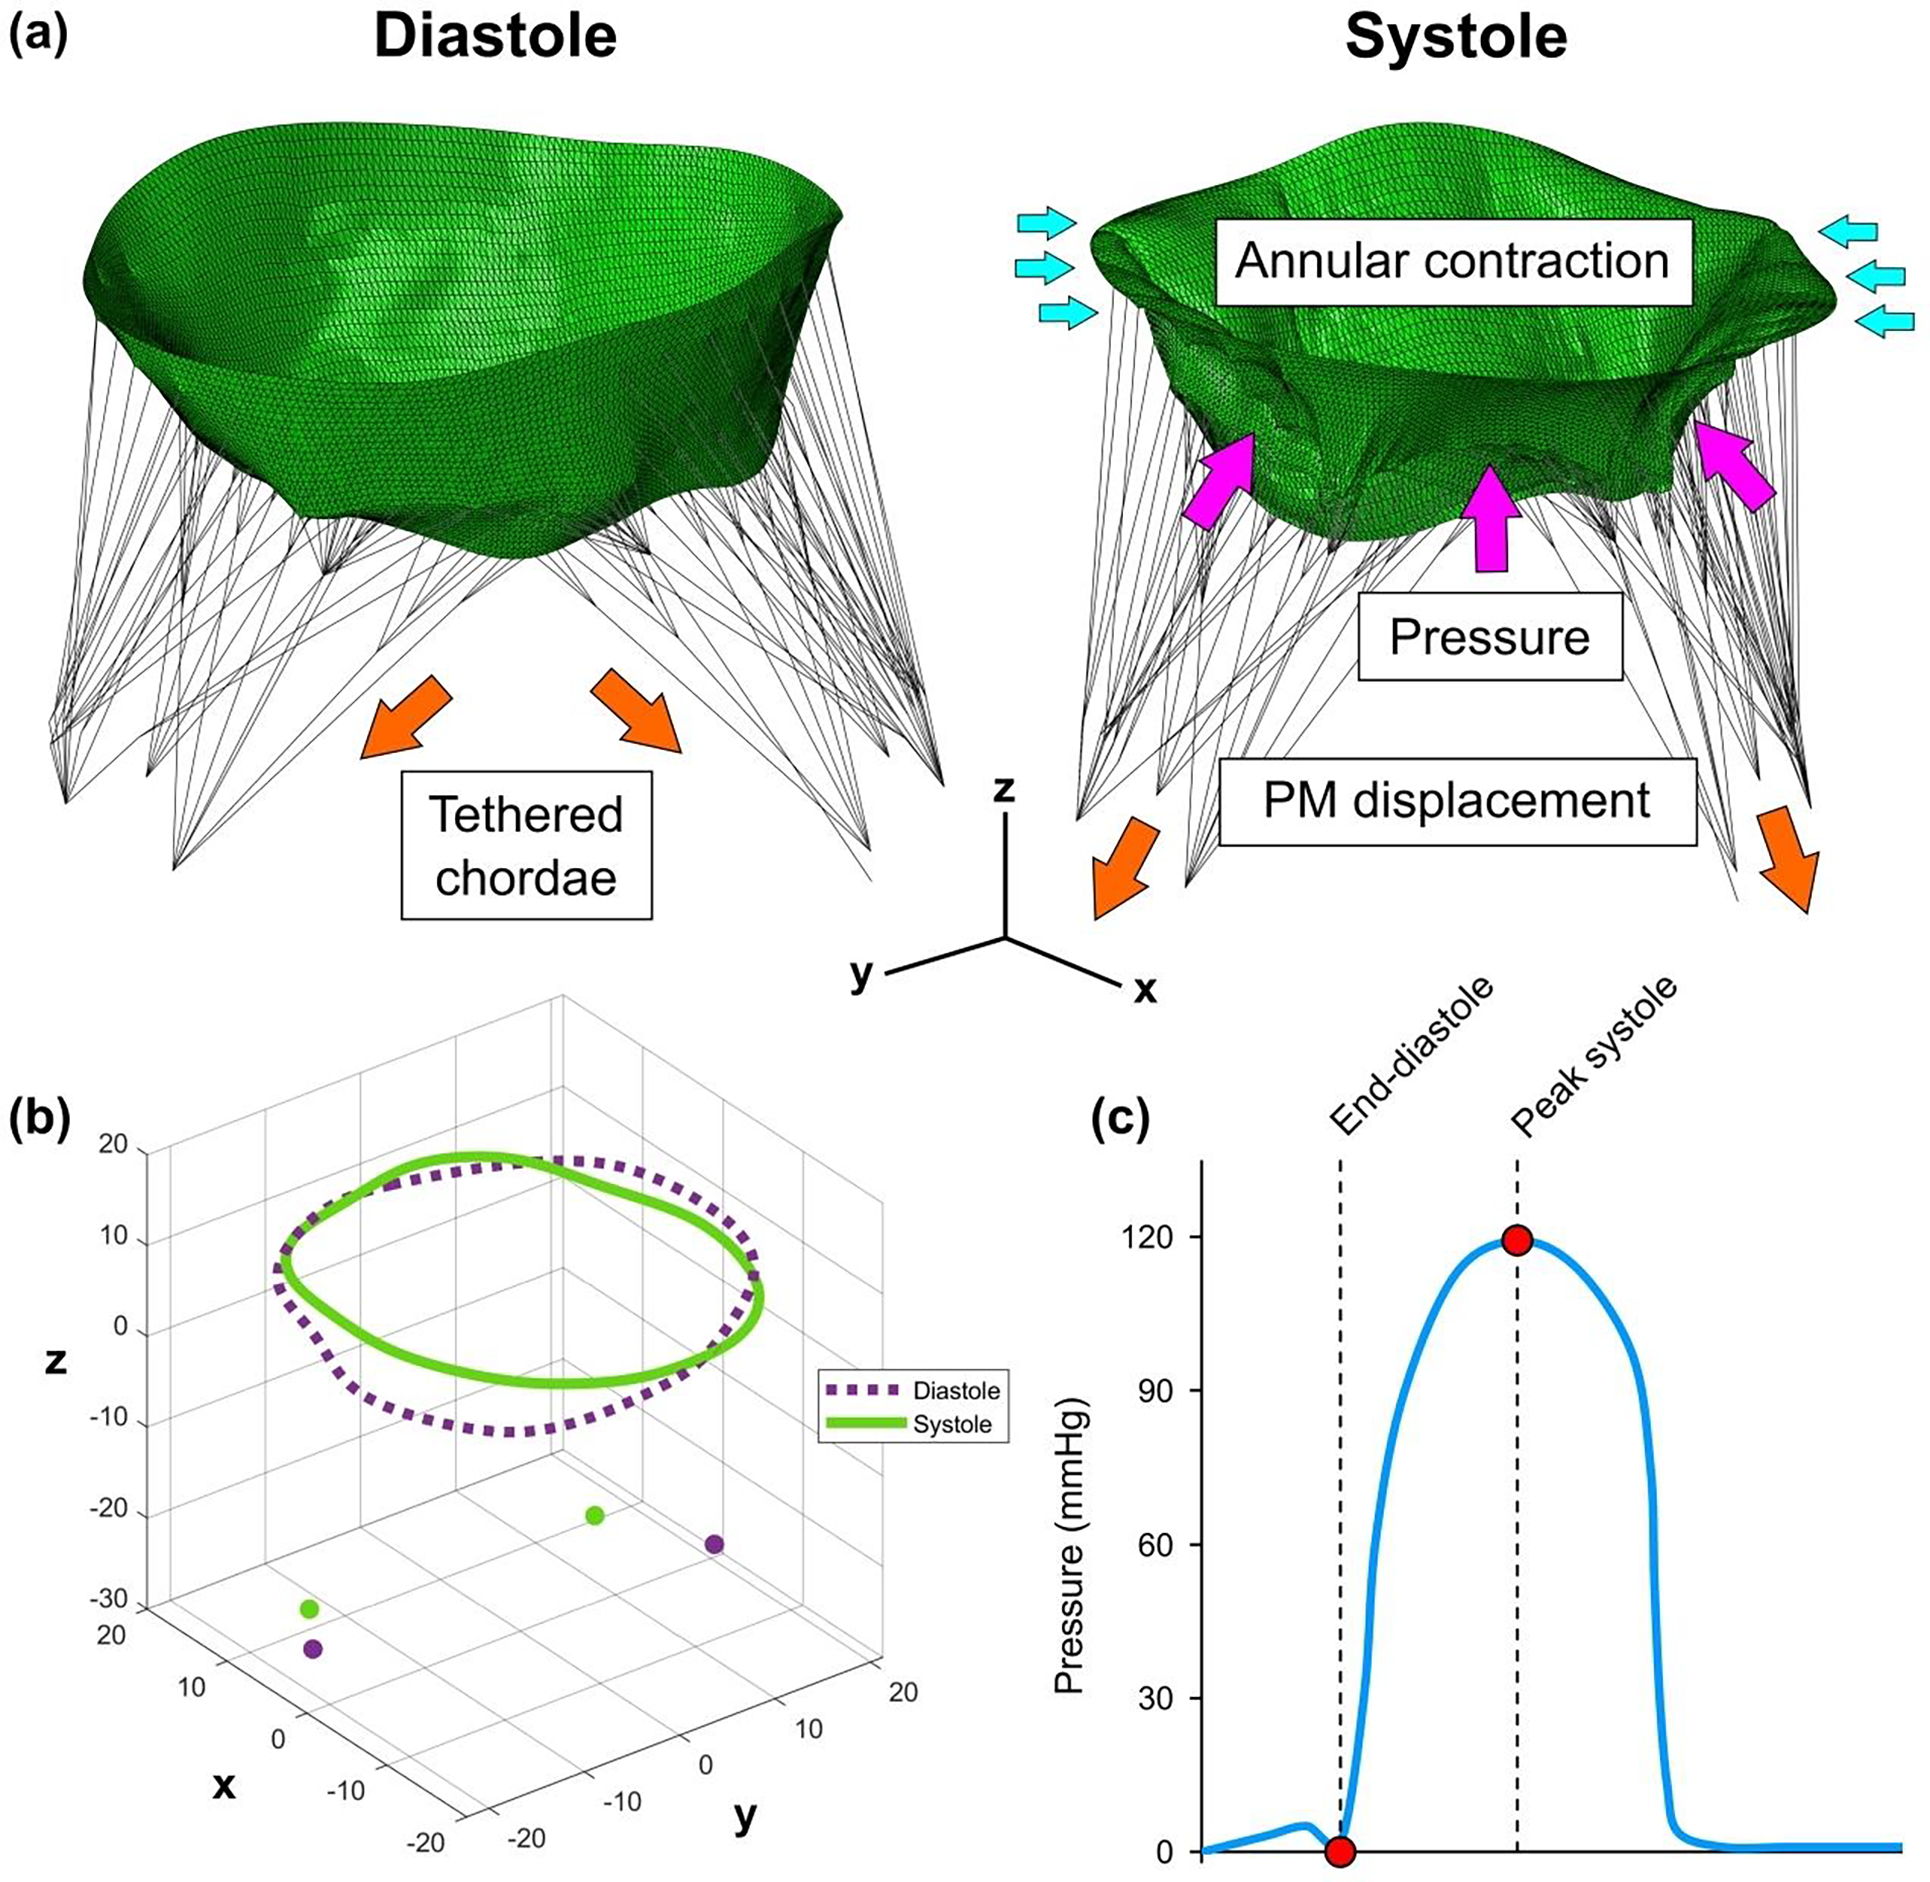
Figure 2.

(a) Mitral valve model showing pre-strained chordae and boundary conditions. (b) Patient-specific systolic and diastolic configuration of mitral annulus and papillary muscle tips. (c) Time-dependent physiologic transvalvular pressure curve with end-diastole and peak systole highlighted as a time frame for the valve closure simulation.
