Figure 4.

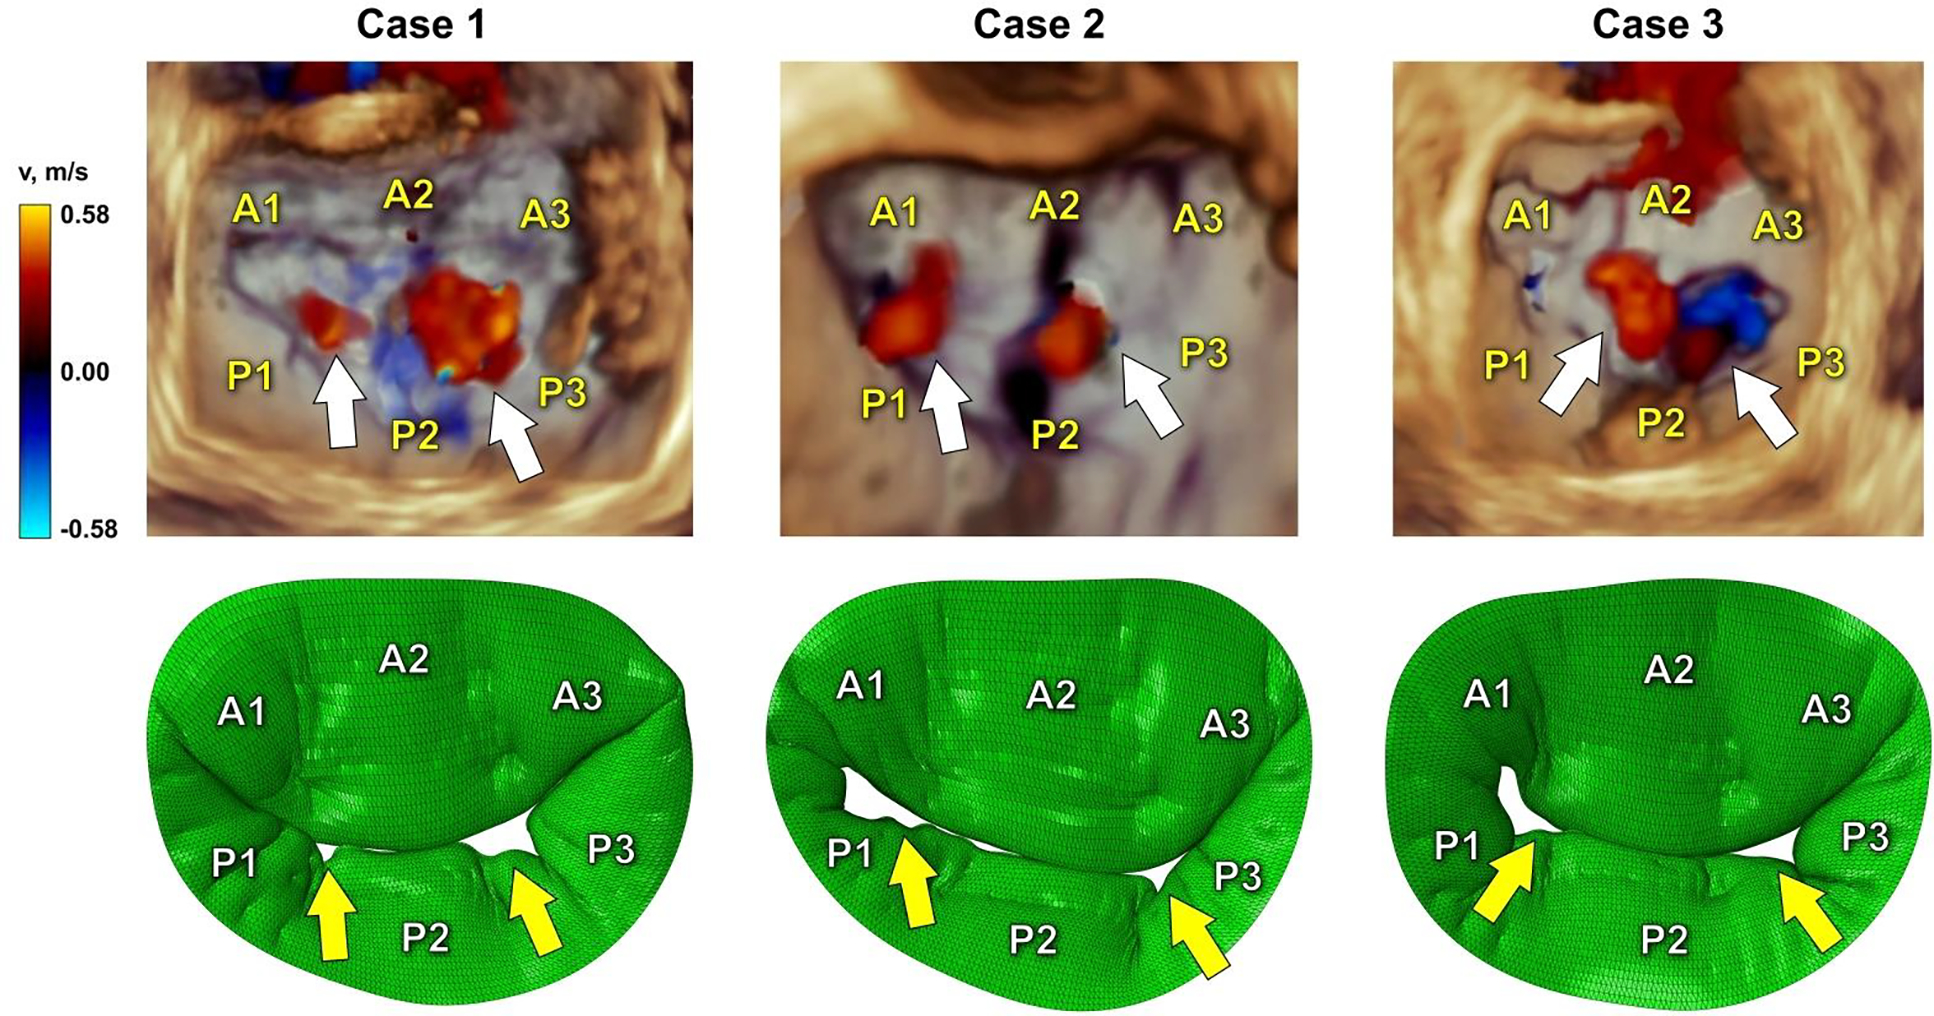
Comparison of 3D color Doppler ultrasound data and simulation results in systole. White arrows indicate regurgitant gaps in echocardiographic images, while yellow arrows show the formation of regurgitant gaps in computational models.

Comparison of 3D color Doppler ultrasound data and simulation results in systole. White arrows indicate regurgitant gaps in echocardiographic images, while yellow arrows show the formation of regurgitant gaps in computational models.