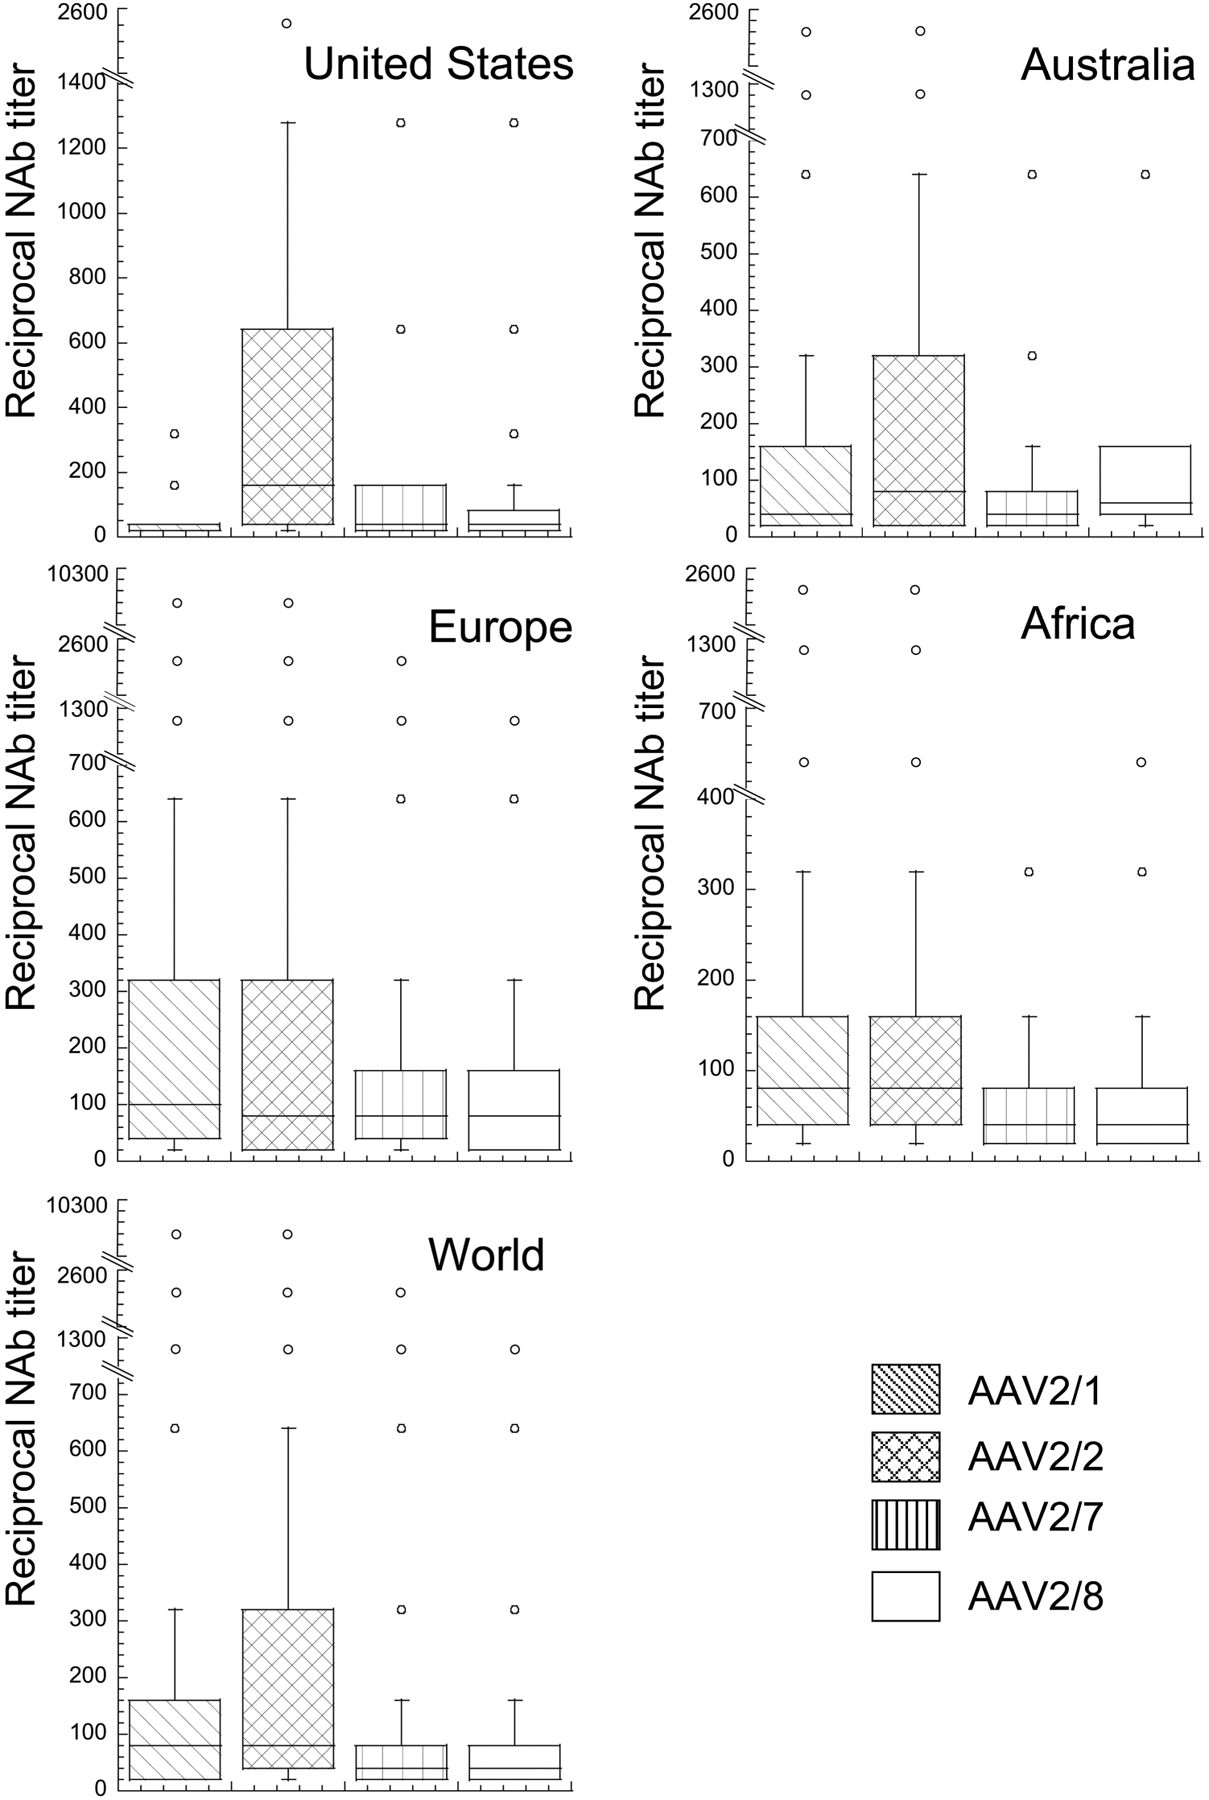
Figure 5.

Global distribution and magnitude of the neutralizing antibody (NAb) response in serum samples from the United States, Australia, Europe, and Africa in which the NAb titer was ≥1:20. Each box encloses 50% of the data, with the upper and lower limits denoting the interquartile range; the horizontal line denoting the median value; the whiskers denoting minimum and maximum values in the data set that fell within an acceptable range; and the circles denoting outliers.
