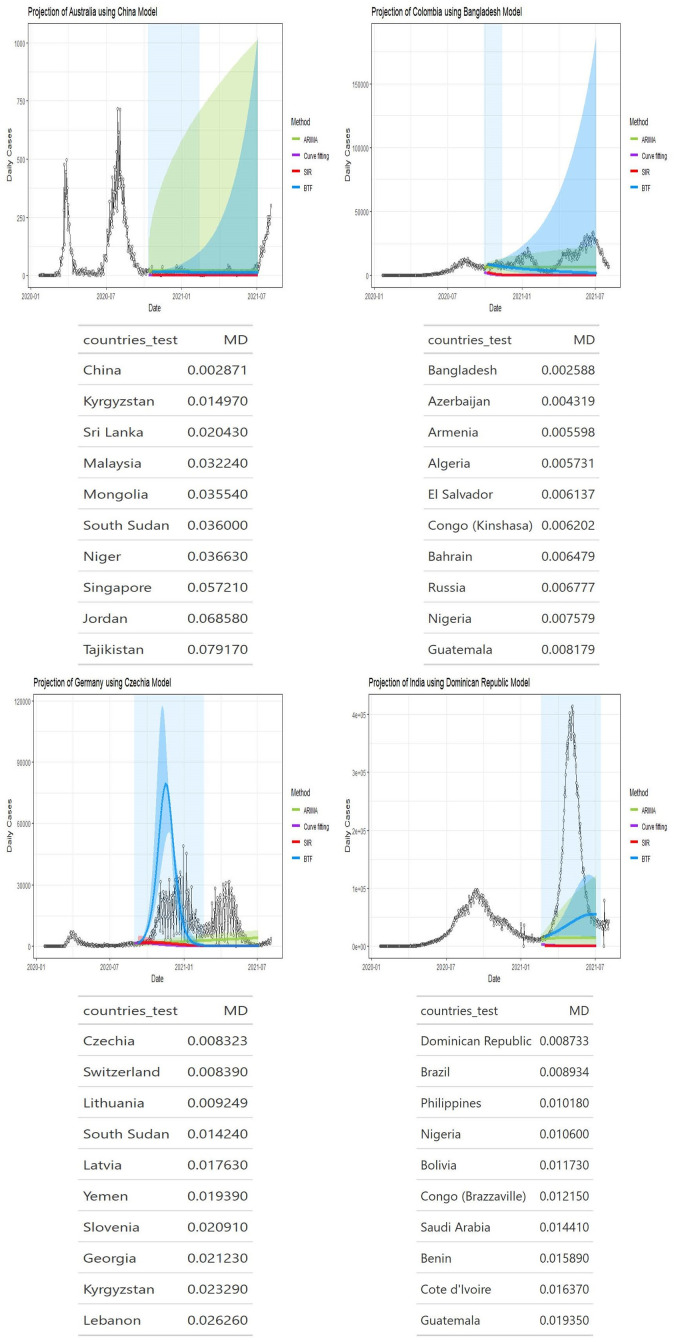
Fig 2. Projection curves for Australia, Colombia, Germany, and India, using BFT projections.
Projected blue curve and region of projection (before inflection point) of next surge in shaded blue. Note that a 10 day washout period is forced before projections start. Matching country ranking tables shown underneath each plot.

