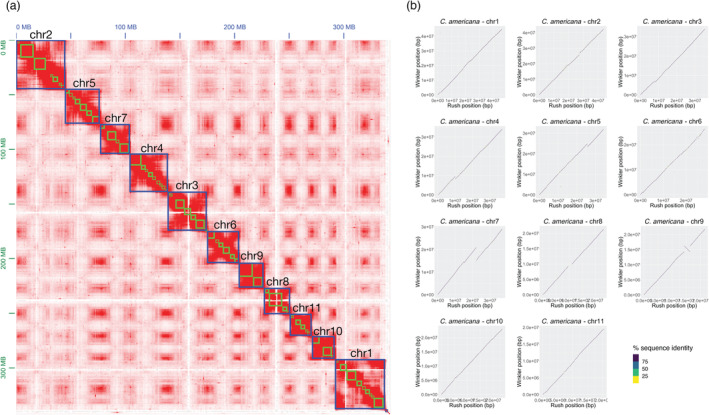
Figure 1.

(a) Contact map showing aligned and sorted Arima Hi‐C data for ‘Winkler’ as visualized in Juicebox; green squares indicate ordered and oriented contigs, and blue squares indicate chromosomes. (b) Whole genome comparison of the ‘Rush’ and ‘Winkler’ chromosome‐scale assemblies. Dotplots of raw windowed alignment were generated by GENESPACE. While small indels are evident, largely consistent synteny is observed across all 11 chromosomes. A single sizeable inversion on chromosome 9 is highlighted in red. Potential inclusion of both haplotypes is only evident in ‘Rush’.
