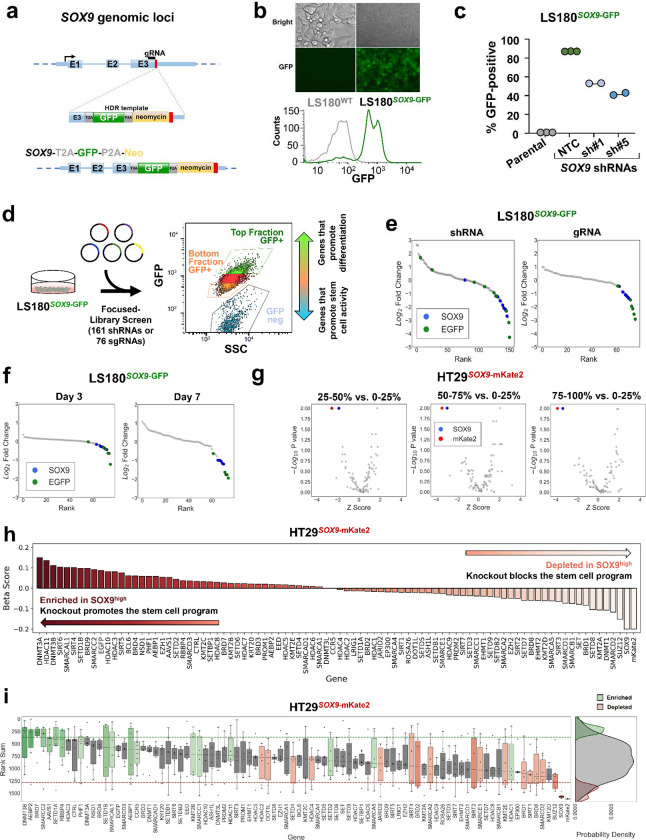
Figure 1. Development of an endogenous reporter by genome editing SOX9 locus.
a. Schematic of SOX9 genomic locus, sgRNA location, homolog arm structure; E1-E3 represent SOX9 exons (top panel). Post-integration genomic locus of the T2A-GFP-P2A-Neo reporter cassette at the SOX9 locus (bottom panel).
b. Distribution of GFP fluorescence intensity of the LS180SOX9-GFP cells and LS180 parental cell line.
c. Percentage of GFP-positive cells in the cell line population of parental LS180 cell line and LS180SOX9-GFP engineered line upon introduction of nontargeting control (NTC) and SOX9 shRNAs.
d. Design of the focused CRISPR-Cas9 screen of 76 sgRNAs and short hairpin RNA genetic screen of 161 shRNAs targeting 8 genes in the LS180SOX9-GFP endogenous differentiation reporter cell line.
e. Ranked log2 fold change plot of focused RNA interference screen and CRISPR-Cas9 screen comparing the top 2.5% to bottom 2.5% GFP positive sorted cell fractions of the LS180SOX9-GFP genome-edited cell line. SOX9 shRNAs and sgRNAs are represented by blue dots. EGFP shRNAs and sgRNAs are represented by green dots.
f. Ranked log2 fold change plot of control CRISPR-Cas9 screen (76 sgRNAs) comparing between the top 2.5% GFP positive and the bottom 2.5% GFP positive sorted cell fractions of the LS180SOX9-GFP genome-edited cell line sequenced after at day 3 and day 7 following library infection.
g. Volcano plot of the epigenetic CRISPR-Cas9 screen (542 sgRNAs targeting 78 genes) comparing 4 sorted cell fractions of the HT29SOX9-mKate2 genome-edited cell line sampled at day 7. Following library infection, HT29SOX9-mKate2 were assigned into 4 sorted fractions based on mKate2 fluorescence intensity. The x axis shows the Z score of gene-level FC (median log2fold change) for all sgRNAs targeting the same gene. The y axis shows the gene-level p values generated by MaGeCK MLE.
h. Beta score of each gene in the epigenetic CRISPR-Cas9 screen comparing between the top 25% mKate2 positive and the bottom 25% mKate2 positive sorted cell fractions of the HT29SOX9-mKate2 cell line from 3 technical replicates
i. Rank sum of each gene in the CRISPR-Cas9 screen targeting epigenetic regulators (78 genes) comparing the top 25% and the bottom 25% of mKate2 positive sorted cell fractions of the HT29SOX9-mKate2 cell line. The y-axis shows the rank sum of each sgRNA targeting each of the 78 genes in the epigenetic library shown on the x-axis (left panel). The rank sum is derived by summing the ordered rank of each sgRNA by fold change across the 3 technical replicates of the screen such that higher rank sum is associated with depletion and lower rank sum is associated with enrichment. Boxplots showing the distribution of sgRNA rank sums per gene are colored in green or red if there are at least 2 sgRNA targeting the same gene whose rank sums are above the enrichment threshold (green) or depletion threshold (red) respectively. Probability density plots showing the distribution of enriched (green), depleted (red), and all other sgRNA (grey) rank sums (right panel).

