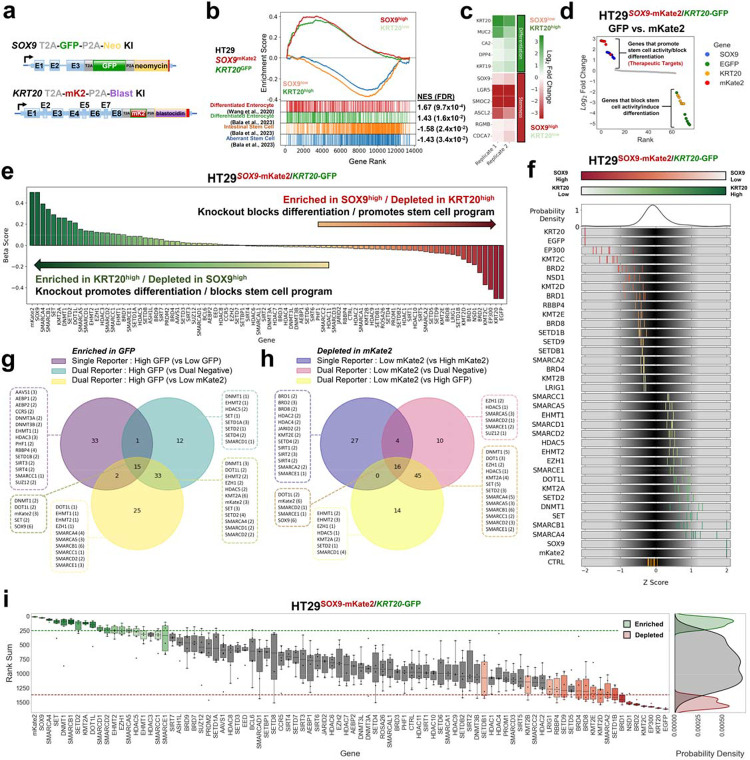
Figure 3. Epigenetic CRISPR screen using dual endogenous reporter system.
a. Schematic of engineered SOX9 and KRT20 loci in dual endogenous reporter lines following GFP and mKate2 HDR template integration, respectively.
b. Gene set enrichment analysis (GSEA) of bulk RNA-seq of mKate2low/GFPhigh fraction and mKate2high/GFPlow FACS sorted fractions from HT-29SOX9-mKate2/KRT20-GFP dual reporter line. Two differentiation signatures are indicated in red and green, followed by a normal stem cell signature in orange, and an aberrant stem cell signature in blue. Normalized enrichment scores (NES) and false discovery rates (FDR) for each signature is listed to the right.
c. Heatmap showing select differentiation and stem cell genes from bulk RNA-seq of mKate2low/GFPhigh fraction and mKate2high/GFPlow fractions from HT-29SOX9-mKate2/KRT20-GFP dual reporter line
d. Ranked log2 fold change plot of focused CRISPR-Cas9 screen (76 sgRNAs) comparing GFPhigh and mKate2low high sorted cell fractions using HT-29SOX9-mKate2/KRT20-GFP cells
e. Beta score of each gene in the epigenetic CRISPR-Cas9 screen (78 genes) comparing mKate2low/GFPhigh fraction and mKate2high/GFPlow using HT-29SOX9-mKate2/KRT20-GFP cell line from 3 technical replicates.
f. Distribution of sgRNA Z-score of log2 fold change of the top and bottom hits from the epigenetic CRISPR-Cas9 screen. sgRNA are colored based on their enrichment (green) or depletion (red) in the mKate2low/GFPhigh fraction compared to the mKate2high/GFPlow using the dual reporter system.
g. Overlap analysis of the number of shared and exclusive hits enriched in the 75–100% GFP fraction compared to 0–25% GFP fraction from the single differentiation program reporter system as well as enriched in mKate2low/GFPhigh compared to the mKate2high/GFPlow fraction or enriched in mKate2low/GFPhigh compared to the mKate2low/GFPlow fraction from the dual reporter system. Top-scoring hits were identified using the rank sum method applied to one replicate of each screen.
h. Overlap analysis of the number of shared and exclusive hits depleted in the 75–100% mKate2 fraction compared to 0–25% mKate2 fraction from the single stem cell program reporter system as well as depleted in mKate2high/GFPlow compared to the mKate2low/GFPlow fraction or depleted in mKate2high/GFPlow compared to the mKate2low/GFPhigh fraction from the dual reporter system. Top-scoring hits were identified using the rank sum method applied to one replicate of each screen.
i. Rank sum score of the 542 sgRNA targeting 78 genes in the CRISPR-Cas9 screen targeting epigenetic regulators comparing the mKate2low/GFPhigh to the mKate2high/GFPlow fractions from the HT-29SOX9-mKate2/KRT20-GFP dual reporter cell line. The y-axis shows the rank sum of each sgRNA targeting each of the 78 genes in the epigenetic library shown on the x-axis. Boxplots showing the distribution of sgRNA rank sums per gene are colored in green or red if there are at least 2 sgRNA targeting the same gene whose rank sums are above the top 15% of all sgRNA rank sum scores(green) or below the bottom 15 of all sgRNA rank sum scores (red) respectively. Probability density plots showing the distribution of enriched hits(green), depleted hits (red), and all other sgRNA (grey) rank sum scores (right panel).

