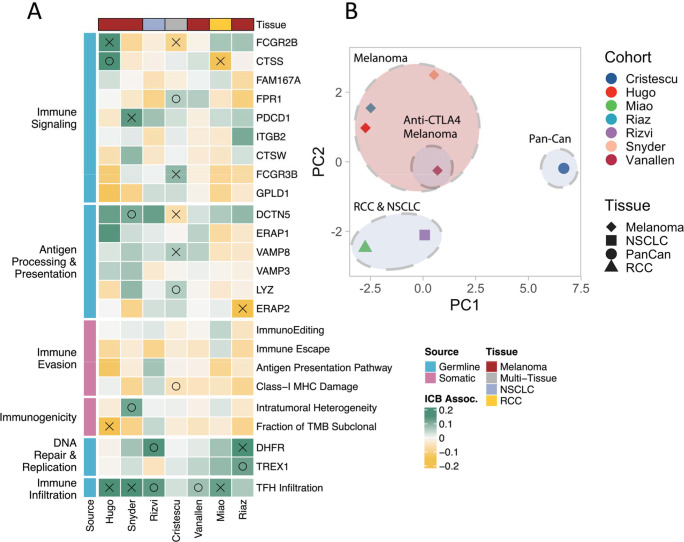
Figure 2: Linear ICB response associations of features passing recursive feature selection.
(A) Features from germline and somatic models passing secondary RFE on the Cristescu pancancer cohort are shown grouped by cohort and biological impact. Coefficients quantifying associations with ICB response calculated from generalized linear model analysis accounting for age and sex are shown. Green coloring indicates a feature that was more associated with a positive ICB response, yellow indicates association with a negative response. Associations with P<=0.05 are marked with an X, P<=0.1 are marked with O. (B) PCA of test statistics for each cohort resulting from linear feature associations.

