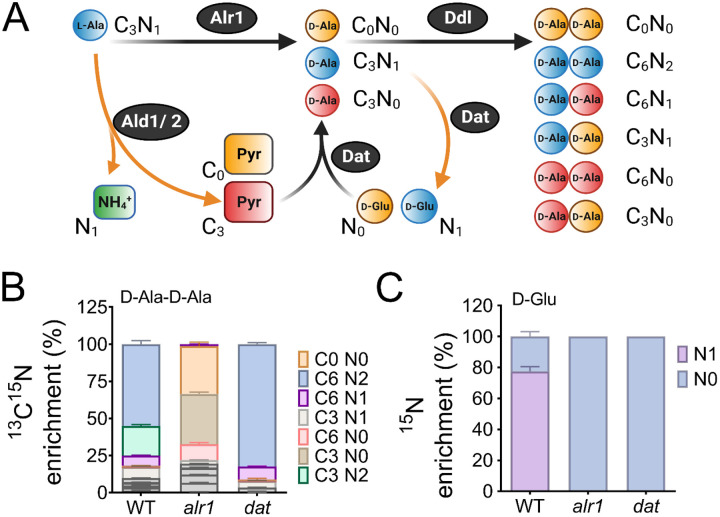
Figure 3. Reaction orientation and fluxes through Alr1 and Dat.
(A) Schematic representation of various isotopologues of d-Ala-d-Ala and d-Glu generated from 13C315N1 labeled l-Ala. Metabolites in blue mainly arise from Alr1, red, through the Ald1/2-Dat pathway and yellow are unlabeled intermediates within cells. The mass isotopologue distribution of (B) d-Ala-d-Ala and (C) d-Glu were determined by LC-MS/MS following the growth of S. aureus in chemically defined media supplemented with 13C315N1 l-Ala (n=3, mean ± SD). Isotopologues of d-Ala-d-Ala shown in grey color are minor species and are noted in Table S9.

