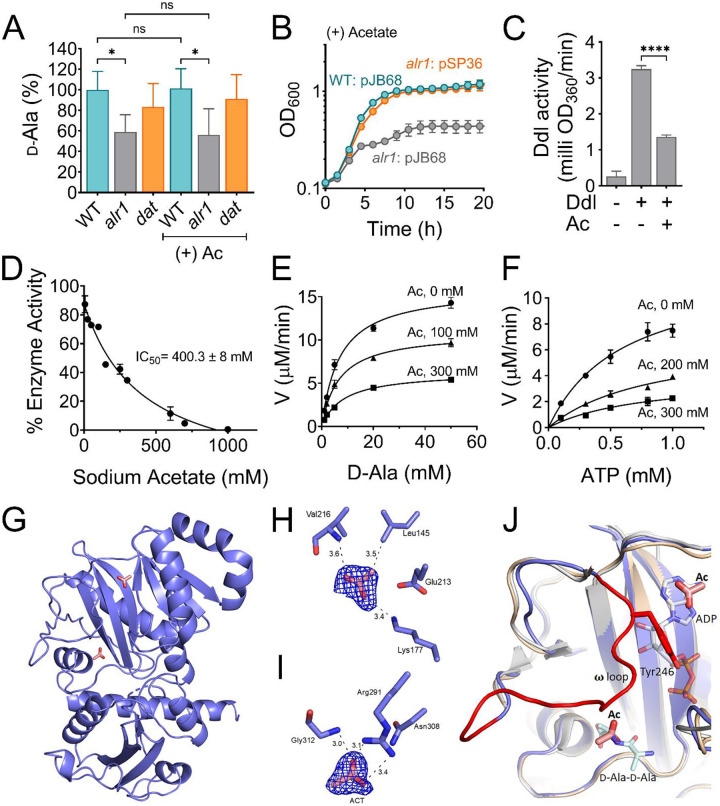
Figure 5. Acetate anion inhibits Ddl activity.
(A) The intracellular d-Ala was determined by LC-MS/MS analysis. (B) The ddl gene was overexpressed in S. aureus using a cadmium inducible expression system (pSP36). CdCl2, 0.312 μM. (C) Inhibition of recombinant His-tagged Ddl activity in the presence of 300 mM sodium acetate (D) IC50 curve of the inhibition of rDdl by acetate. Michaelis-Menten kinetics of rDdl in varying concentrations of (E) d-Ala, and (F) ATP in the presence of acetate to assess the inhibition mechanism. (G) Structure of the acetate bound Ddl (PDB:8FFF). (H) Acetate bound to the ATP binding site of Ddl (I) Acetate bound to the second d-Ala binding site of Ddl. The calculated Fo-Fc omit maps are contoured to 3σ and the mesh is shown in blue. (J) Superimposed structure of acetate bound Ddl (slate blue) with StaDdl apo structure (PDB:2I87, beige) and StaDdl-ADP complex structure (PDB:2I8C, grey) showing a shift of ω loop (red) to ATP binding site. The d-Ala-d-Ala was modeled at the d-Ala binding site using Thermos thermophius HB8 Ddl structure (PDB:2ZDQ). The bound ADP (grey) of PDB:2I87 and modeled d-Ala-d-Ala (light blue) indicates the positioning of Ac at ATP and second d-Ala binding sites respectively. Ac, acetate; V, velocity; *, P value <0.05; ****, P value <0.0001.

