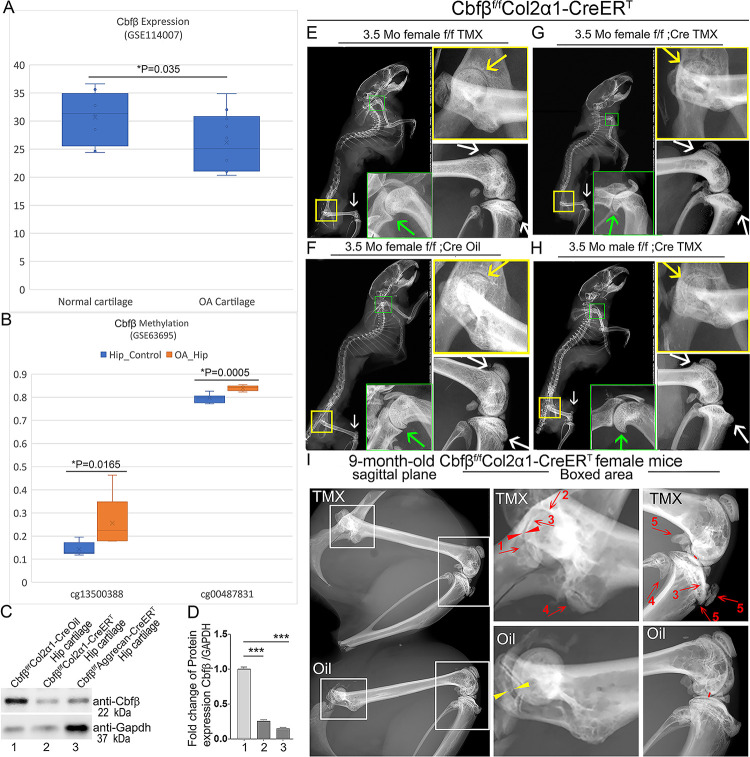
Figure 1. Tamoxifen (TMX) induced Cbfβf/fCol2α1-CreERT mice developed spontaneous OA.
(A) Public human RNA-seq dataset (n=8) (GSE114007) showing Cbfβ mRNA expression level in Normal and OA patient cartilage. (B) Public human methyl-seq dataset (n=5) (GSE63695) showing methylation at the Cbfβ promoter region (cg13500388 and cg00487831) in Normal and OA hip tissue. Statistical significance was assessed using Student’s t-test. Values were considered statistically significant at p<0.05. (C) Western blot to examine Cbfβ protein levels in the hip articular cartilage of 3.5-month-old male oil injected Cbfβf/fCol2α1-Cre and TMX injected Cbfβf/fCol2α1-CreERT, and 4-month-old male TMX injected Cbfβf/fAggrecan-CreERT mice (n=3). (D) Quantification of (C). (E) X-ray of 3.5-month-old TMX injected female Cbfβf/f mouse hip, shoulder, and knee joint (n=15). (F) X-ray of 3.5-month-old oil injected female Cbfβf/fCol2α1-CreERT mouse hip, shoulder, and knee joint (n=15). (G) X-ray of 3.5-month-old TMX injected female Cbfβf/fCol2α1-CreERT mouse hip, shoulder, and knee joint (n=12). (H) X-ray of 3.5-month-old TMX injected male Cbfβf/fCol2α1-CreERT mouse hip, shoulder, and knee joint. Green arrow: osteophytes in shoulder; yellow arrow: hip joint space; white arrow: hyperosteogeny in knee. (I) X-ray image of hips and knee joints of 9-month-old female Cbfβf/fCol2α1-CreERT mice with oil injection and Cbfβf/fCol2α1-CreERT mice with TMX injection (n=9). Red arrow 1,2,3: worn articular cartilage; Red arrow 4,5: osteophytes (spurs); Red arrow head: narrow joint space; Yellow arrow head: healthy hip joint space.
Figure 1-Source data. Raw western blot images for Figure 1C.

