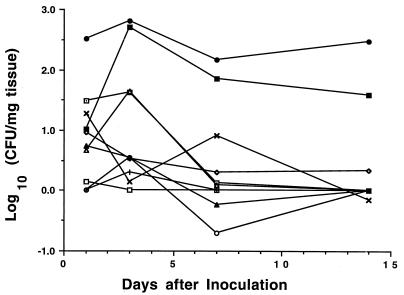
FIG. 2.
Time course of E. coli kidney infections in inbred mouse strains. Mice were inoculated intravesically with 108 E. coli CFU on day 0 and sacrificed at day 1, 3, 7, or 14. Each point represents the mean number of E. coli CFU in kidneys from 5 or 6 mice. Symbols are as defined for Fig. 1.

