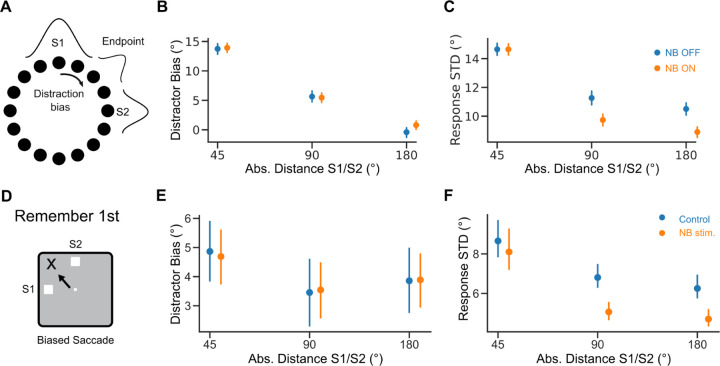
Figure 4. Distraction effect on response variance is distance dependent.
A. Distraction by S2 shifts model responses (Distraction Bias). B. Distraction bias vs. absolute distance between S1 and S2. C. Response standard deviation (STD), computed as the square root of the response variance, vs. absolute distance between S1 and S2. Blue: NB OFF condition ( = 10Hz). Orange: NB ON condition ( = 30Hz). D. Distractor shifts responses in the task. E. Distraction bias vs. absolute distance between S1 and S2 in Remember 1st trials in the data. F. Same but for response STD. Error bars 95% bootstrapped confidence interval. Orange dots are shifted on the x-axis for visibility.

