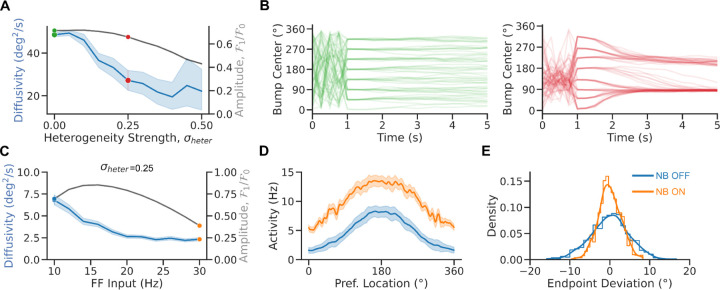
Figure 5. Heterogeneities impair bump diffusion.
A. Diffusivity vs. heterogeneity strength (averaged over 8 cues and 25 initial conditions per cue and 100 network realizations). B. Bump center vs. time in the homogeneous (left panel) and heterogeneous (right panel) bump attractor network (for 8 cues and 10 initial conditions per cue for one network realization). C. Diffusivity (averaged over 8 cues and 250 initial conditions per cue, blue) and bump amplitude (black) vs. FF input in the heterogeneous network model (averaged over 8 cues and 125 initial conditions per cue and one network realization, = 0. 25, see Material and Methods). D. Population tuning curve for NB ON and NB OFF (matching colors in C). E. Bump endpoint deviation (i.e., mean corrected endpoint) for NB ON and NB OFF. Lines: kernel density estimates. Error bands 95% confidence intervals.

