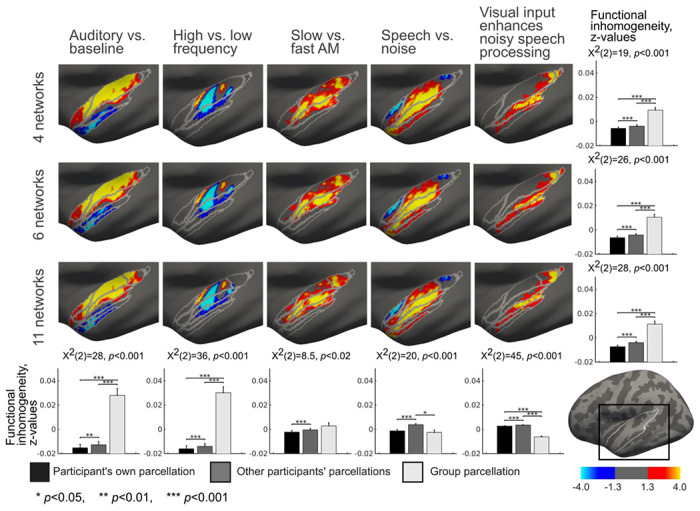
Figure 5.

Topographic correspondence between the STC parcellations and GLM task contrasts in the left hemisphere. The group-level parcellation is overlaid on the group-level GLM contrasts computed from auditory and audiovisual tasks. The bar diagrams in the right column show functional inhomogeneity averaged over all contrasts within each of the three parcellations. The bar diagrams in the bottom row show functional inhomogeneity averaged over all parcellations within each of the five contrasts. The functional inhomogeneity was computed between the individual GLM contrast map of each participant and 1) their own individual–specific parcellation, 2) individual-specific parcellation of all other participants, and 3) group-average parcellation. The differences between these three conditions were estimated with the Friedman test and pairwise Wilcoxon signed rank tests. The results were corrected for multiple comparisons using Benjamini-Hochberg procedure [55]. Error bars indicate standard errors of the mean (SEM).
