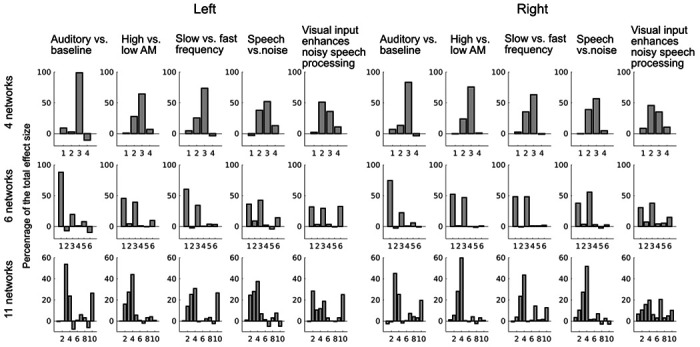
Figure 7.

Functional specificity of the STC parcellations. The percentage of the total effect size is shown for each network in each parcellation. The task effect was concentrated within certain networks, suggesting functional specificity of the parcellations.
