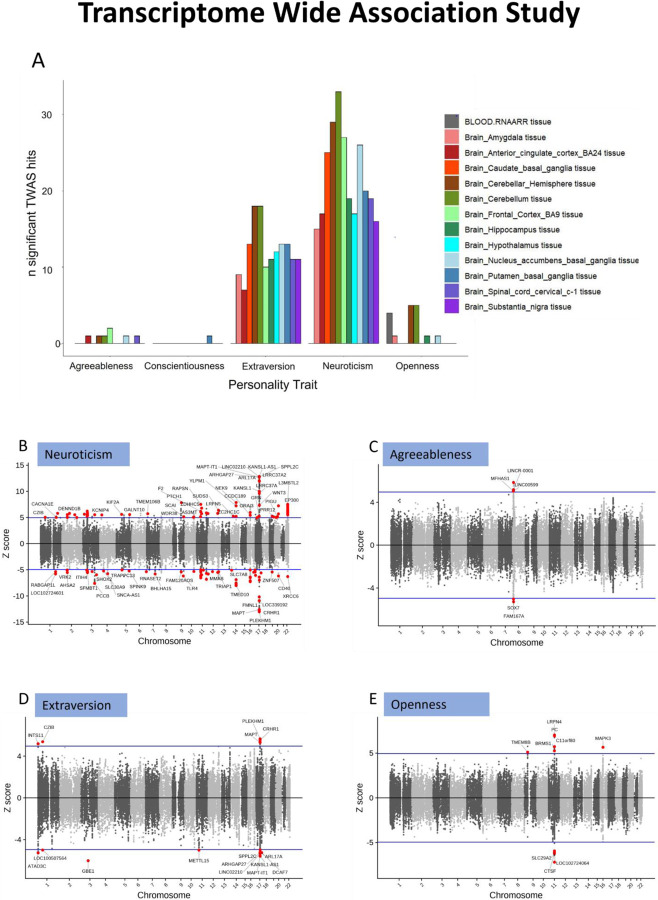
Figure 3:
(A) bar chart showing the number of significant TWAS genes/transcripts found four personality traits with significant findings in respective sub-tissues. (B–E) scatter plots with TWAS z-scores of each gene/transcript plotted on y-axis and its respective chromosomal location plotted on x-axis. The significant hits are shown in red circles with mapped gene names as labels. The blue horizontal line indicates the significance threshold of z-score corresponding to Bonferroni-corrected p-value. Conscientiousness data is reported in Supplemental Sheet 4.

