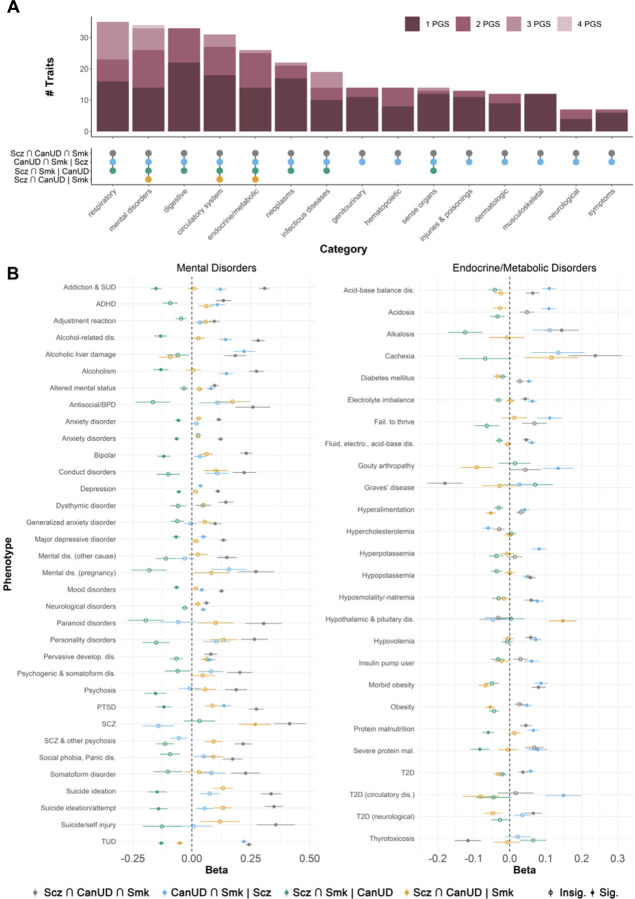
Figure 4. Associations between polygenic scores for SNP subsets from ASSET and health-related phenotypes in the BioVU biobank.
Panel A: Upset plot showing the number of phenotypes within different categories associated with one or more PGS. Panel B: Forest plots showing associations between the four ASSET SNP subset PGSs and mental disorders (left panel) and endocrine/metabolic traits (right panel) in BioVU.

