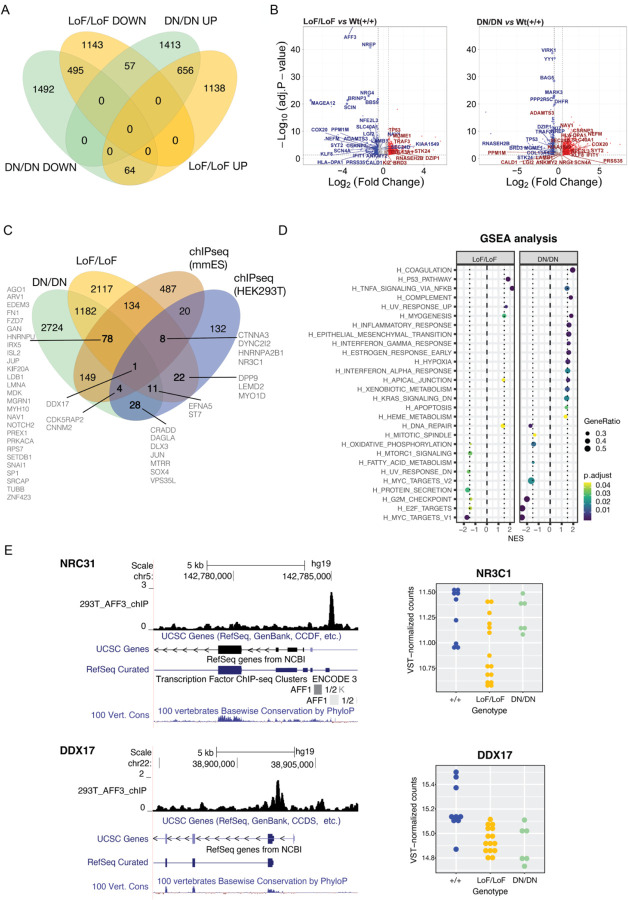
Figure 3. Transcriptome profiles of engineered isogenic HEK293T cells.
(A) Four-way Venn diagram of differentially expressed genes (DEGs) in biallelic loss-of function (LoF/LoF) AFF3 lines and biallelic dominant negative (DN/DN) AFF3 KINSSHIP lines upon comparison with unmutated wildtype lines. DEGs counts are stratified in genes up- (UP) and downregulated (DOWN). (B) Volcano Plots of DEGs in biallelic loss-of function (LoF/LoF) AFF3 lines (left panel) and biallelic dominant negative (DN/DN) AFF3 KINSSHIP lines (right panel) upon comparison with unmutated wildtype lines. The top 30 most significant DEGs in LoF/LoF that are dysregulated in an opposite manner in DN/DN are indicated, together with some of the most differentially expressed genes (-log10(Padj)>20 and abs(log2FoldChange) > 0.5). (C) Gene Set Enrichment Analysis (GSEA) for hallmark pathways of DEGs in biallelic loss-of function (LoF/LoF) AFF3 lines (left panel) and biallelic dominant negative (DN/DN) AFF3 KINSSHIP lines (right panel) upon comparison with unmutated wildtype lines. (D) Four-way Venn diagram of differentially expressed genes (DEGs) in biallelic loss-of function (LoF/LoF) AFF3 lines and biallelic dominant negative (DN/DN) AFF3 KINSSHIP lines upon comparison with unmutated wildtype lines and AFF3 ChIP-seq peaks identified in HEK293T cells (HEK293T) and in Mus musculus ES cells (mmES). DEGs bound by AFF3 discussed in the text are indicated. (E) Examples of DEGs NRC31 (top) and DDX17 (bottom) loci bound by AFF3. UCSC genome browser snapshot showing from to top to bottom AFF3 ChIP-seq HEK293T results, UCSC and REFSeq curated gene structure and vertebrate PhyloP conservation scores (left panels). Expression level of NRC31 (top) and DDX17 (bottom) in +/+ (blue), LoF/LoF (yellow) and DN/DN (green) HEK293T engineered lines (right panels).

