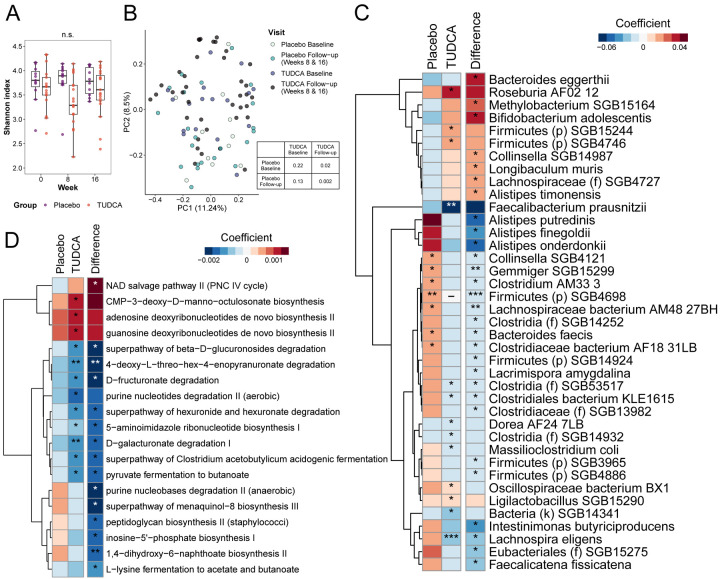
Figure 3. Changes in gut microbiome in the clinical trial.
(A) Microbiome alpha-diversity measured by Shannon index in TUDCA and placebo (linear model). (B) PCoA of Bray-Curtis dissimilarity by group and visit (follow-up visits clustered together) demonstrating beta-diversity; table demonstrates pairwise p-values obtained from PERMANOVA. (C and D) Microbiota species (C) and pathways (D) that changed over time in TUDCA independently, as well as with comparison with placebo group (difference). *p<0.05, **p<0.01, ***p<0.01

