. 2024 Jan 30;13:e79714. doi: 10.7554/eLife.79714

Figure 1. Timeline of new and published genomes.

(A) 204 newly reported genomes (black circles) are shown alongside published genomes (gray circles), ordered by time and region (colored the same way as in B). (B) Sampling locations of newly reported (black) and published (gray) genomes are indicated by diamonds, sized according to the number of genomes at each location.

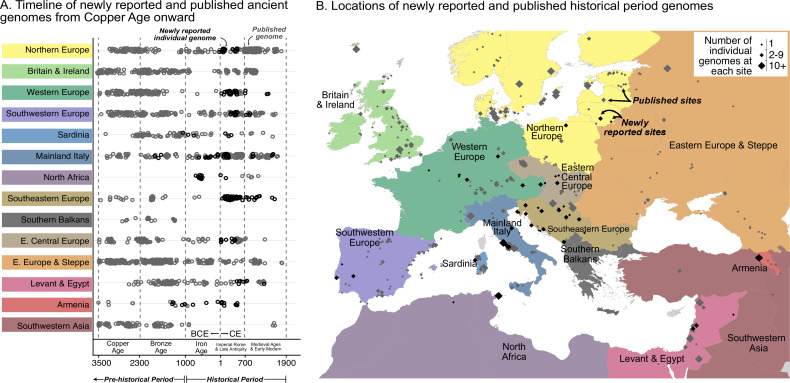
Figure 1.

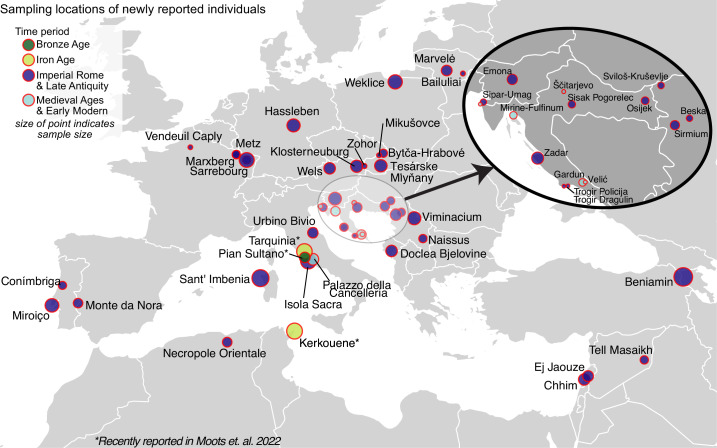
Figure 1—figure supplement 1. Detailed map of locations for newly reported samples.

Figure 1—figure supplement 1.

Each circle represents a location, the size of the circle corresponds to the number of individuals sampled from that location. Circles are colored by their time period: Bronze Age is green (Pian Sultano), Iron Age is yellow (two recently reported sites Tarquinia and Kerkouane), Imperial Rome and Late Antiquity is dark blue, Medieval Ages and Early Modern are light blue (Palazzo della Cancelleria, Velić, Gardun, Mirine-Fulfinum). Note that the Bronze Age and Iron Age sites were recently reported in Moots et al., 2022.