Figure 1.
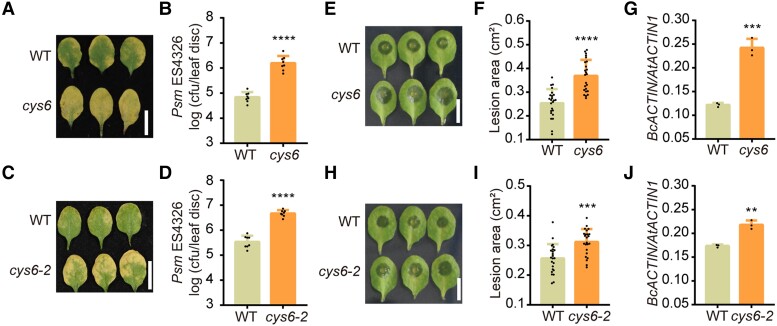
CYS6 enhances plant resistance to broad-spectrum pathogens. A) and C) Representative leaves of 3-wk-old WT, cys6A), and cys6-2C) after Psm ES4326 (OD600 nm = 0.0001) infection at 3 d postinoculation (dpi). B) and D) Bacterial titer after Psm ES4326 infection in WT, cys6B), and cys6-2D). cfu, colony forming unit. E) Representative leaves of 3-wk-old WT and cys6 mutant after B. cinerea (1 × 10⁵ spores/mL) infection at 40 h postinoculation (hpi). F) and G) Lesion sizes caused by B. cinerea on leaves of WT and the cys6 mutant as measured with ImageJ F) and quantification of B. cinerea biomass, based on RT-qPCR analysis of genomic DNA from diseased leaves for BcACTIN with AtACTIN1 as a reference G). H) Representative leaves of 3-wk-old WT and the CRISPR/Cas9-generated cys6-2 mutant after B. cinerea (1 × 10⁵ spores/mL) infection at 40 hpi. I) and J) Lesion sizes caused by B. cinerea on leaves of WT and the cys6-2 mutant as measured with ImageJ I) and quantification of B. cinerea biomass, based on RT-qPCR analysis of genomic DNA from diseased leaves for BcACTIN with AtACTIN1 as a reference J). Significant differences relative to WT were detected using Student’s t test. Data are shown as means ± Sd (n = 8 for B) and D); n = 24 for F) and I); n = 3 for G) and J)). *P < 0.01; ***P < 0.001; ****P < 0.0001.

