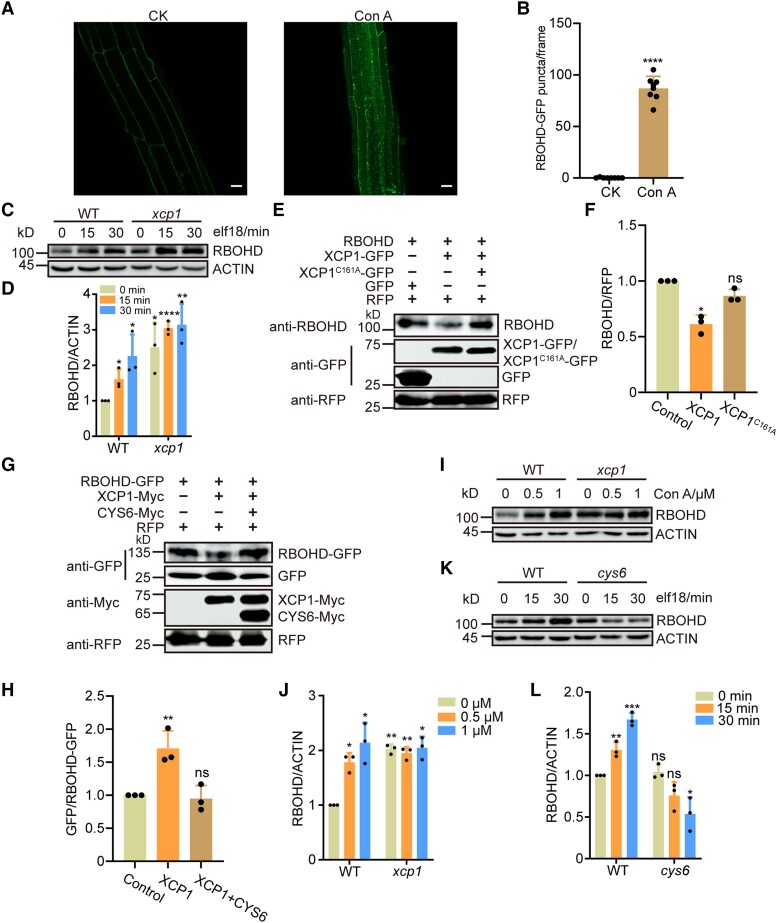
Figure 7.
The stability of RBOHD is modulated by XCP1 and CYS6 in a vacuole-dependent manner. A) and B) Con A treatment results in the accumulation of RBOHD-GFP in puncta within the vacuole. Confocal microscopy images of the roots of 7-d-old seedlings expressing RBOHD-GFP treated with DMSO (CK) or 1 µM Con A for 20 h A) and number of RBOHD-GFP puncta B). Data are shown as means ± Sd (n = 8). Scale bar, 20 µm. C) and D) RBOHD levels in 12-d-old WT and xcp1 seedlings after 1 µM elf18 treatment; samples were collected at the indicated time points after treatment for immunoblots C). Quantification of relative protein levels using ImageJ D). Data are shown as means ± Sd (n = 3). E) and F) Agrobacterium cultures expressing RBOHD were mixed with Agrobacteria harboring XCP1-GFP or XCP1C161A-GFP and infiltrated into N. benthamiana leaves. Samples were collected 3 d later for immunoblots E). Quantification of relative protein levels using ImageJ F). Data are shown as means ± Sd (n = 3). G) and H)RBOHD-GFP was coexpressed with XCP1-Myc or XCP1-Myc and CYS6-Myc in N. benthamiana leaves. Samples were collected 3 d after infiltration for immunoblots G). Quantification of relative protein levels by ImageJ H). Data are shown as means ± Sd (n = 3). I) and J) Twelve-d-old WT and xcp1 seedlings were treated with different concentrations of Con A for 18 h before sample collection; RBOHD levels were measured by immunoblots I). Quantification of relative protein levels using ImageJ J). Data are shown as means ± Sd (n = 3). K) and L) RBOHD levels measured in 12-d-old WT and cys6 seedlings after 1 µM elf18 treatment; samples were collected at the indicated time points after treatment K). Quantification of relative protein levels by ImageJ L). Data are shown as means ± Sd (n = 3). Significant differences were detected using Student’s t test. *P < 0.05: **P < 0.01: ****P < 0.0001; ns, no significant difference.

