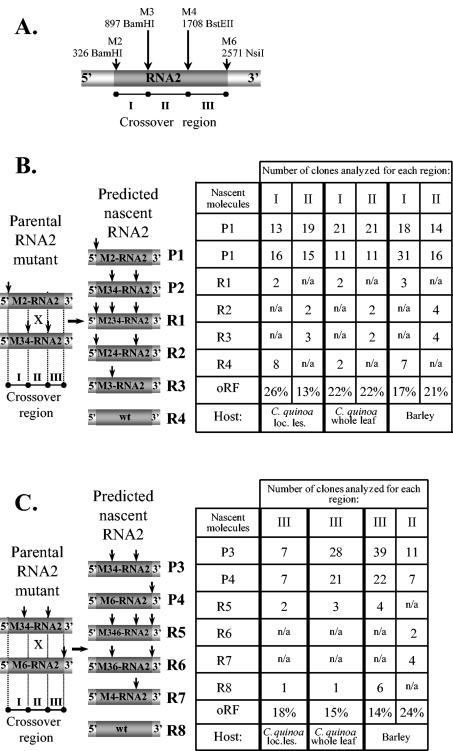
FIG. 2.
Analysis of homologous recombinant BMV RNA2 progeny in doubly infected C. quinoa or barley hosts. (A) The location of marker mutations within M-RNA2 is shown schematically. Two pairs of parental RNA2 mutants, designated as P1 through P4, corresponding to M2-RNA2/M34-RNA2 (B) or M34-RNA2/M6-RNA2 (C) pairs, and the projected RNA2 recombinants (designated as R1 through R8) are shown on the left. All the elements are as described in the Fig. 1 legend. The tables on the right show the distribution of the parental and recombinant cDNA clones in the progeny RNA2 variants found in total RNA extracts either from the combined local lesion tissue or from the whole-leaf tissue of the infected C. quinoa or barley tissues, along with the oRF. Parental molecules and recombinants are labeled, while vertical arrows represent marker restriction sites. The progeny RNA2 was amplified by RT-PCR using total RNA extracts, and the resulting cDNA products were cloned and analyzed by restriction enzyme digestion and by sequencing, as described in Materials and Methods. Recombinants R1 through R4, R2 and R3, and R5 through R8 are created by homologous crossovers within regions I, II, and III, respectively, of RNA2. Because only 50% of local lesions (loc. les.) on C. quinoa leaves were doubly infected with both parental RNA1 or RNA2 variants, the recombination frequencies for the whole-leaf samples were approximated by dividing into half the number of the examined clones. n/a, not analyzed.

