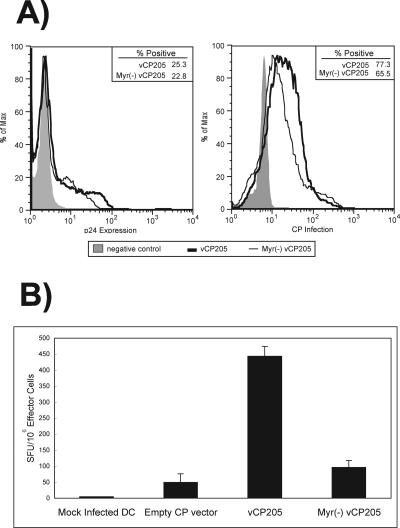
FIG. 7.
In vitro human DC antigen presentation by vCP205 and Myr− vCP205. (A) Expression of HIV p24/Gag protein (left) and rates of infection (right) in DC infected with vCP205, Myr−vCP205, or control. The negative control for p24 expression was DC infected with empty canarypox vector. The negative control for infection was mock-infected DC. (B) IFN-γ ELISPOT analysis of T-cell responses following coculture with DC infected with empty canarypox vector, vCP205, or Myr− vCP205 or mock infected. Data are shown as the mean value from triplicate wells plus standard deviation.

