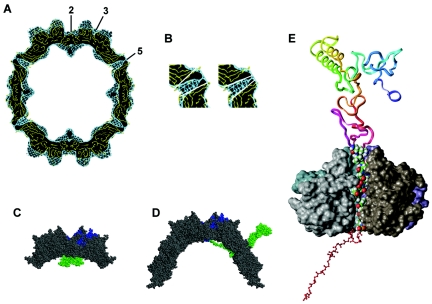
FIG. 6.
Image reconstruction compared to atomic model of AAV-2. Molecular modeling of the VP1 N-terminal region. The reconstruction of the empty capsid (blue) was superimposed with the atomic model of the capsid (1LP3) (yellow). (A) An equatorial slice of the capsids is shown. (B) Sections of a fivefold symmetry axis are marked with white lines to demonstrate the difference of the opening of the channels at the fivefold symmetry axes in the atomic model (left) and the 3D image reconstruction (right). (C) Part of an equatorial slice through an AAV-2 capsid where the N-terminal stretch of the VP1 protein (green) was modeled and linked to one of the two VP3 subunits (blue) at the twofold symmetry axis is illustrated. (D) Partial defolding of the VP1 terminus which allows its exposure through a channel at a fivefold symmetry axis where the PLA2 domain which is located within the N terminus becomes accessible on the capsid surface. (E) The partly defolded VP1 domain was fitted into the channel at the fivefold symmetry. The backbone of residues located outside the capsid (amino acids 1 to 168) is represented as a ribbon and color coded with sequence succession from blue (residues 1 through 10) to red (residues 160 through 170). The atoms of residues modeled within the channel (amino acids 169 to 185) are given as space filled model representation using an atom color code (green, carbon; white, hydrogen; blue, nitrogen; red, oxygen). The backbones of residues inside the capsid (amino acids 186 to 209) are colored red and represented by a ball and stick model. The solvent-accessible surface of the four displayed VP3 units forming the channel is depicted in various grey tones. The fifth VP3 domain is not displayed to enable a view of how the defolded VP1 strand fits into the channel.

