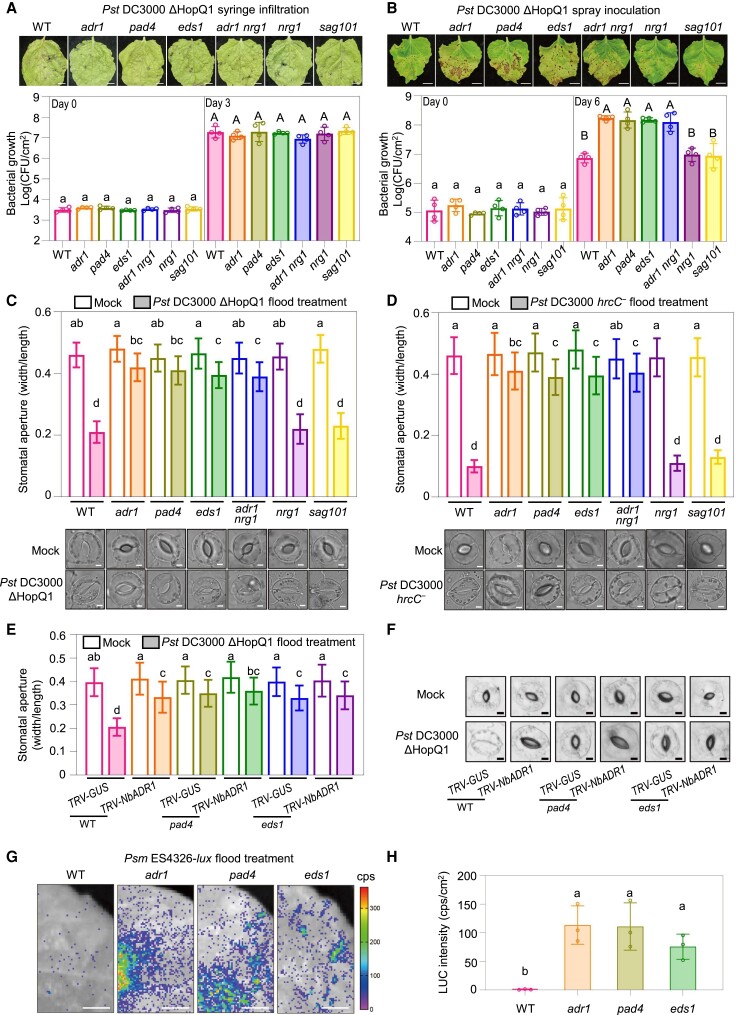
Figure 2.
NbADR1, NbPAD4, and NbEDS1 mediate bacterial pathogen-induced stomatal closure. A, B) Disease symptoms and bacterial populations in leaves of the Nicotiana benthamiana wild-type (WT), adr1, pad4, eds1, adr1 nrg1, nrg1, and sag101 at 4 d (A, upper panel), or at 0 and 3 d (A, lower panel) postsyringe infiltration, or at 10 d (B, upper panel), or 0 and 6 d (B, lower panel) postspray inoculation with Pseudomonas syringae pv. tomato (Pst) DC3000 ΔHopQ1 (OD600 = 0.0001 for syringe, OD600 = 0.4 for spray), respectively. Data are means (±Sd) of 4 biological replicates from independent plants. Letters indicate significant differences by 1-way ANOVA analysis (Tukey's post hoc test, P < 0.05). The experiments were repeated 3 times with similar results. Scale bars represent 1 cm. C, D) Stomatal apertures and images of stomata in leaves of N. benthamiana WT and the indicated mutants after 1 h of flood treatment with mock (10 mM MgCl2) or Pst DC3000 ΔHopQ1 (OD600 = 0.4) (C), and Pst DC3000 hrcC− (OD600 = 0.4). D) Data are means ± Sd; n = 50 stomata. Letters indicate significant differences by 1-way ANOVA analysis (Tukey's post hoc test, P < 0.05). Scale bars represent 5 μm. The experiments were repeated 3 times with similar results. E, F) Stomatal apertures E) and images of stomata F) in leaves of N. benthamiana WT and the indicated mutants with TRV-GUS or TRV-NbADR1, after 1 h of flood treatment with mock (10 mM MgCl2) or Pst DC3000 ΔHopQ1 (OD600 = 0.4). Data are means ± Sd; n = 50 stomata. Letters indicate significant differences by 1-way ANOVA analysis (Tukey's post hoc test, P < 0.05). Scale bars represent 5 μm. The experiments were repeated 3 times with similar results. G, H) Bacterial pathogen entry assay in leaves of N. benthamiana WT and the indicated mutants. The leaves were photographed and the luciferase (LUC) intensities were quantified by a CCD imaging system after 1 h of P. syringae pv. maculicola (Psm) ES4326-lux flood treatment (OD600 = 0.5). Data are means (± Sd) of 3 biological replicates from independent plants. Letters indicate significant differences by 1-way ANOVA analysis (Tukey's post hoc test, P < 0.05). Scale bars represent 1 cm. The experiments were repeated 3 times with similar results. CFU, colony-forming unit; cps, counts per second.

