
Figure 6. The correlation between the baseline refraction and the amount of RPR at 25 degree in the nasal and temporal retina at baseline without a lens (r=-0.44, P<0.001; represented by the black squares and black line), MFGP design A lens (r=0.42, P=0.05; represented by the red diamonds and red solid line), design B (r=0.65, P<0.001; represented by the blue diamonds and blue solid line), design C (r=0.70, P<0.001; represented by the red circles and red dashed line) and lens design D (r=0.75, P<0.001; represented by the blue circles and blue dashed line).
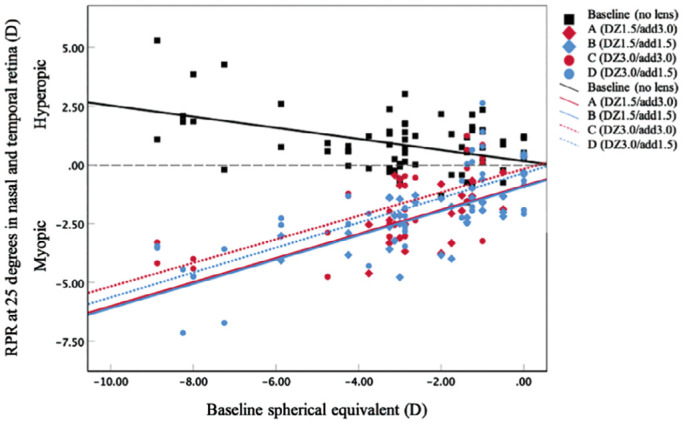
RPR: Relative peripheral refractive; DZ: Distance zone diameter; Add: Addition power.