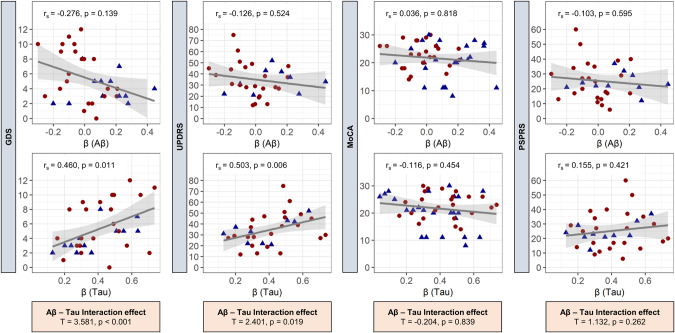
Fig. 4. Correlation of AT associated microglial activation with clinical performance.
Standardized coefficients β (single patient regression), to detect Aβ (A)- and tau (T)- associated microglial activation, were correlated with clinical performance scores (Spearman’s correlation coefficient, rs). For statistical calculations, 4RT, AD-CBS, and AD were pooled.  = 4RT,
  = AD-CBS + AD. Correlation analyses were adjusted for sex, age, global-patient-TSPO-load (mean z-scores of 246 VOIs), and global-patient-AT-load (mean z-scores of 246 VOIs of the respective biomarker). No correction for multiple testing was applied. Subsequently, A and T were tested for interaction effects. AD Alzheimer’s disease, AD-CBS corticobasal syndrome with AD-pathology, 4RT four-repeat tauopathies, LAB low affinity binder, CTRL healthy controls, TSPO 18-kDa translocator protein, Aβ β-amyloid, GMV gray-matter-volume, MoCA Montreal-Cognitive-Assessment-Scale, MMSE Mini-Mental State Examination, UPDRS Unified-Parkinson’s-Disease-Rating-Scale (motor part), PSPRS Progressive-Supranuclear-Palsy-Rating-Scale, GDS Geriatric-Depression-Scale.

