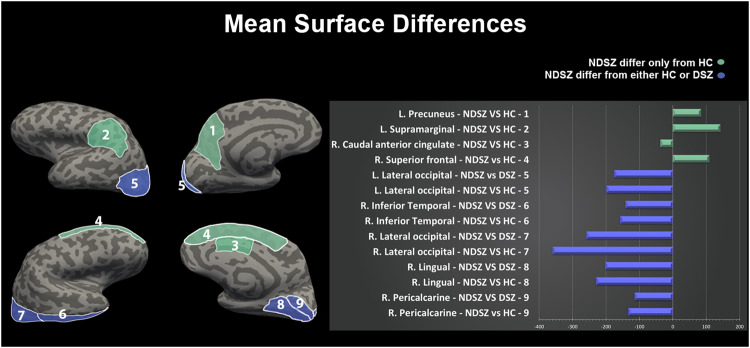
Fig. 2. Bonferroni corrected post hoc comparisons from the mega-analysis on surface area. Mean differences comparing Deficit and Non-Deficit Schizophrenia samples to Healthy Controls.
L. Left Hemisphere, R. Right Hemisphere, DSZ Deficit Schizophrenia group, NDSZ Non-Deficit Schizophrenia group, HC Healthy Controls group, Histogram represents the mean differences in each surface area comparison. Green bars represent regions in which NDSZ significantly differ from HC only; violet bars represent regions in which NDSZ significantly differ from either HC or DSZ.

