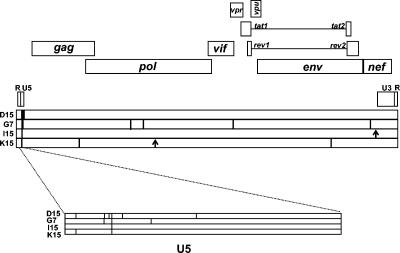
FIG. 4.
Distribution in the complete genome of all mutations appearing during large population passages. Horizontal bars below the gene organization scheme represent the genomes of the four clones studied. Vertical lines illustrate nonsynonymous mutations, whereas vertical arrows indicate synonymous mutations. The 5′ U5 region was expanded in order to more precisely map the mutations accumulated in the clones.

