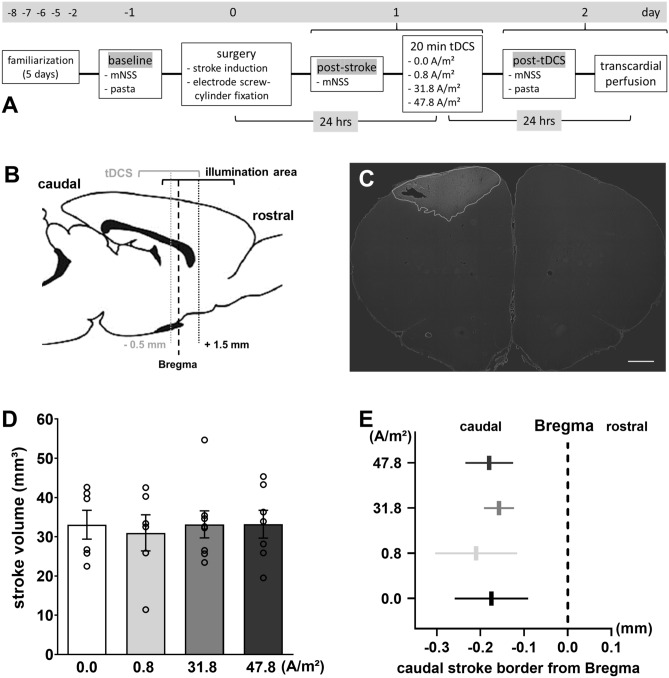
Figure 1.
Experimental overview and lesion data. (A) Experimental timeline. (B) Schematic sagittal rat brain drawing depicting the tDCS area and the illumination area (photothrombotic stroke induction); midpoint of the areas in relation to bregma (dotted lines). (C) Representative image of a FJ-C-stained histological brain slice; stroke delineated in white; 1000-µm scale bar. Photothrombosis resulted in comparable (D) infarct volume and (E) extension of the caudal stroke border, independent of the group. 0.0 A/m2 (n = 6), 0.8 A/m2 (n = 5), 31.8 A/m2 (n = 8), 47.8 A/m2 (n = 7). mNSS modified neurological severity score, pasta pasta handling task, tDCS transcranial direct current stimulation. Data represent mean ± SEM, scatter = individual animals.

