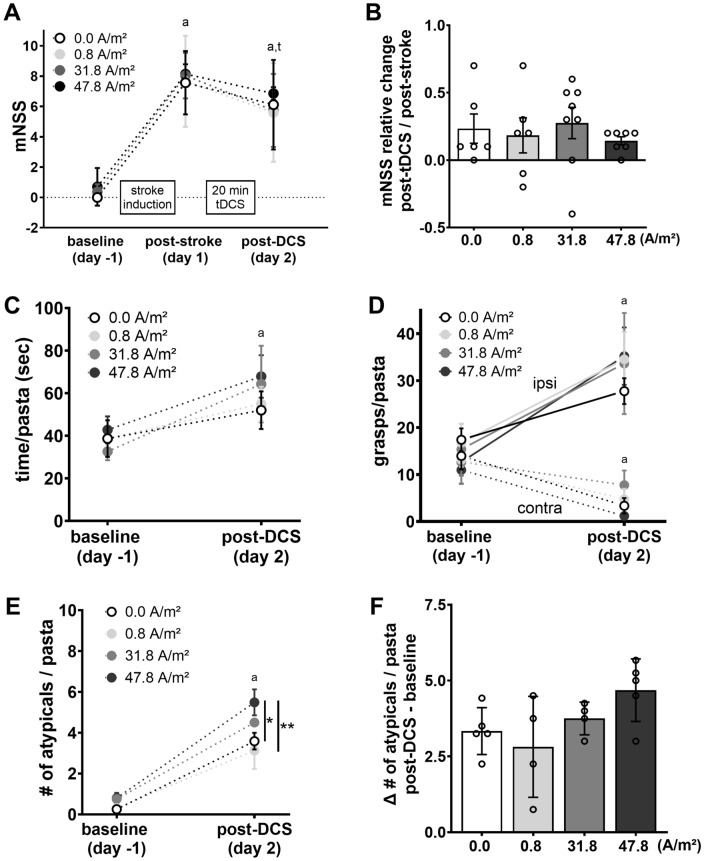
Figure 2.
Effects of tDCS on neurological and behavioral deficits after photothrombotic stroke. (A) Across groups stroke led to a neurological impairment reflected by an increase in mNSS scores at post-stroke (day 1), followed by a slight decrease post-DCS (day 2). (B) The relative mNSS changes from (day 1) to (day 2) did not differ between stimulation groups. (C) Stroke resulted in general impairment in the pasta handling task assessed by the time needed per pasta. (D) Post-intervention contralateral forelimb impairment as indicated by asymmetrical distribution of grasps per pasta between limbs across all groups. (E) Stroke increased atypical behavior counts per pasta in all groups. The 47.8 A/m2 DCS group showed the highest counts on (day 2). (F) Analysis of atypical behavior counts from (baseline) to (day 1) revealed no difference between stimulation modalities. mNSS: 0.0 A/m2 (n = 6), 0.8 A/m2 (n = 5), 31.8 A/m2 (n = 8), 47.8 A/m2 (n = 7); pasta handling task: 0.0 A/m2 (n = 5), 0.8 A/m2 (n = 4), 31.8 A/m2 (n = 4), 47.8 A/m2 (n = 5). mNSS modified neurological severity score, tDCS transcranial direct current stimulation, atypicals atypical behaviors. Data represent mean ± SEM, scatter = individual animals. aDifferent from baseline (day -1); ttrend towards difference from post-stroke (day 1), *p < 0.05, **p < 0.01.

