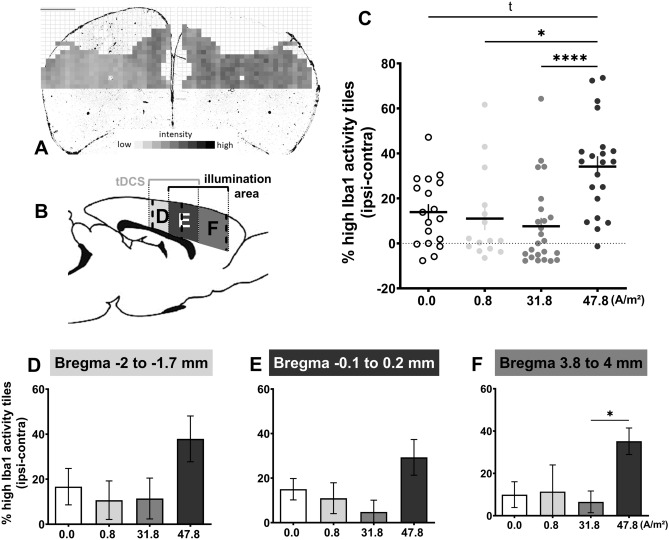
Figure 3.
Effect of tDCS 24 h after photothrombotic stroke on microglia activation (A) Exemplary depiction of the 200 × 200 µm tiles utilized for analysis of high Iba1-reactivity, taken from region F in (B). Note that the non-lesioned hemisphere (left side on the figure) defined the corresponding tiles on the lesion side (right). (B) Schematic drawing of a rat brain in the sagittal plane with projection of the region underlying tDCS only (D; light grey), tDCS and photothrombosis (E; dark grey), and photothrombosis only (F; medium grey), and the location of the analyzed slices within the region (dotted lines). (C) The ratio of high Iba1-reactivity tiles across all regions was highest with 47.8 A/m2 tDCS and comparable between the other stimulation groups (ratio of high reactivity tiles per hemisphere, contralesional subtracted from ipsilesional). (D–F) Separation of the data corresponding to the regions depicted in (B) reflects this pattern for 47.8 A/m2 in each region, particularly in region F (photothrombosis only) vs. 31.8 A/m2. 0.0 A/m2 (n = 6), 0.8 A/m2 (n = 5), 31.8 A/m2 (n = 8), 47.8 A/m2 (n = 7). tDCS transcranial direct current stimulation. Data represent mean ± SEM, scatter in C = individual animal data points sampled across the 3 regions. ttrend, *p < 0.05, ****p < 0.0001.

