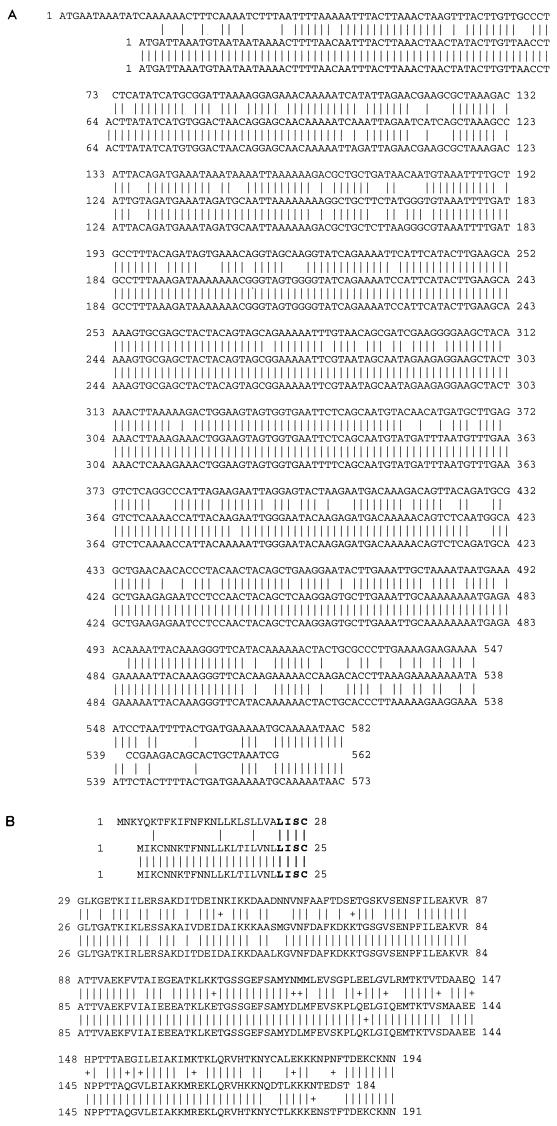
FIG. 2.
Sequence comparison of DbpA of B. burgdorferi sensu stricto isolates N40 (top row), 297 (center row), and B31 (bottom row), based on data published in GenBank for 297 and in reference 27a for B31. (A) Nucleic acid comparison among dbpAs. The vertical lines between rows represent identity among all three strains. Empty spaces in sequence represent missing nucleotides compared to other strains. Note the difference in the N40 leader sequence. (B) Amino acid comparison among dbpAs. Vertical lines between rows represent identity among all three strains, whereas a + represents amino acid similarity between two strains. Bold print represents the signal peptidase II consensus sequence.

