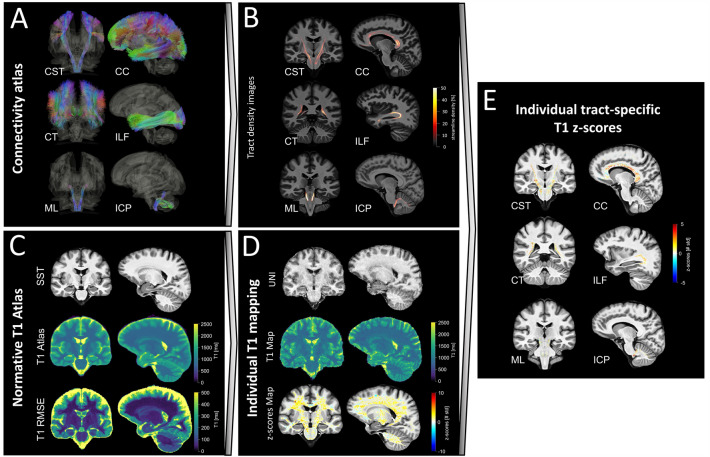
Fig. 1.
Pipeline used to extract white matter, tract-specific T1 abnormalities shown here for six example white matter tracts. A White matter tract streamlines from a connectivity atlas [31]. B Normalized tract density images representing the percentage of streamlines passing through each voxel for each individual white matter tract, registered to SST space. C T1 normative voxel-wise atlas estimated from the healthy cohort and using sex and age as covariates. D Estimation of T1 deviations from the normative atlas in terms of z-scores for individual patients. E Estimation of tract-specific T1 z-scores in each patient. CST cortico-spinal tract; CT corticostriatal pathway; ML medial lemniscus; CC corpus callosum; ILF inferior longitudinal fasciculus; ICP inferior cerebellar peduncle; SST spinothalamic tract; RMSE root mean squared error; UNI uniform MP2RAGE image

