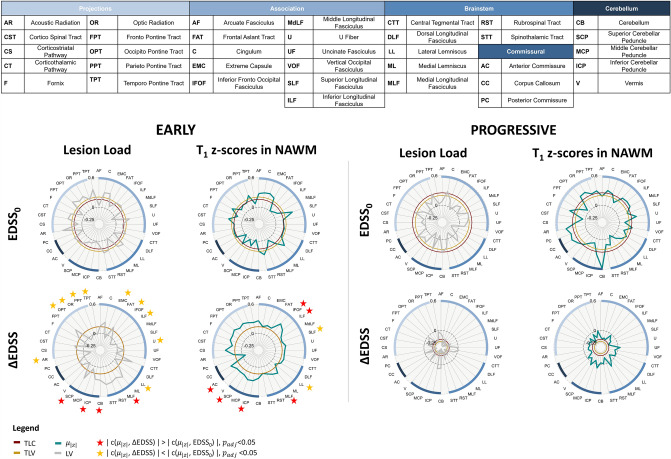
Fig. 3.
Spearman correlations between white matter tract-specific metrics and EDSS in early (left half) and progressive MS (right half) cohorts. We estimated correlation of tract-specific lesion volume (LV, gray, first column) and T1 abnormalities in the NAWM (second column). We computed the average absolute z-score value in each tract (, teal). Correlations to EDSS0 are shown in top rows and ΔEDSS in bottom rows. The inner circles represent the correlation of TLC (red) and TLV (gold). Red (/yellow) stars highlight tracts that yield to significantly higher (/lower) correlations to ΔEDSS compared to cross-sectional EDSS. Tract abbreviations are provided in the table. NAWM normal-appearing white matter; EDSS0 expanded disability status scale, ΔEDSS change in EDSS after 2 years; TLC total lesion count; TLV total lesion volume; LV tract-specific lesion volume

