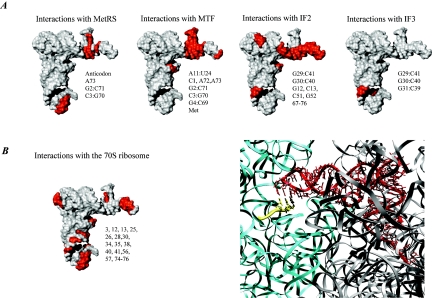
FIG. 6.
Interactions of the initiator tRNA. (A) Surface representations of the initiator tRNA. The regions that interact with the indicated component of the translational machinery are highlighted in red, and the nucleotide positions on the tRNA are indicated next to the structure. The structure of the initiator tRNA is derived from PDB entry 2FMT. (B) Detailed view of the interaction between the initiator tRNA and the ribosome. On the left is a surface representation showing the important sites of interaction in red. On the right is the initiator tRNA on the 70S ribosome. The tRNA is shown in red, the mRNA is shown in yellow, and the 16S and 23S rRNA are shown in cyan and grey, respectively. The codon-anticodon interaction is shown (the structure is derived from PDB entries 1GIX and 1GIY, prepared using the program Ribbons [25], and rendered in Pov-Ray).

