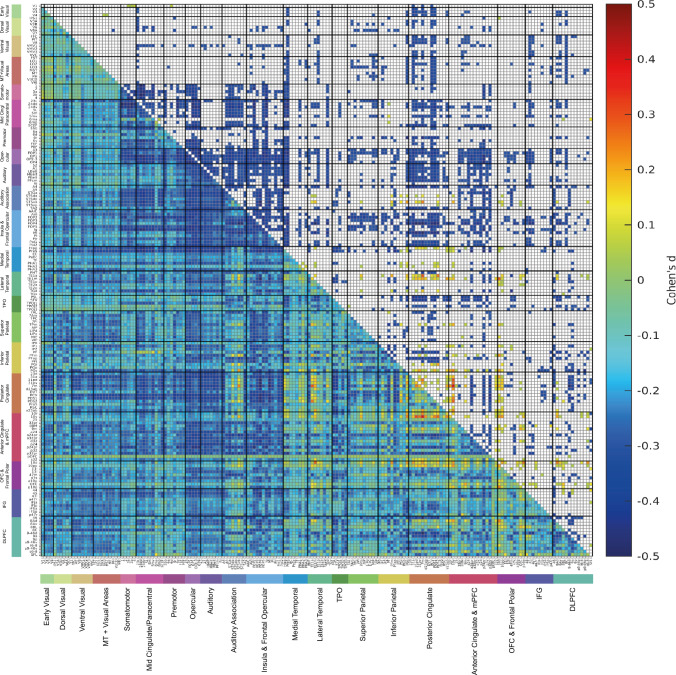
Fig. 3.
The lower left triangle shows the matrix of functional connectivity differences for females—males with the Cohen’s d values showing the effect size of the differences. The matrix is for the functional connectivities in the left hemisphere, as listed in Table S1, with V1, V2, V3 … at the top of the y axis and the left of the x axis. The upper triangle matrix shows the Cohen’s d values of the top 20% significant negative links and all significant positive links after Bonferroni correction (corrected p < 3.1e−6). These results were from 19,396 females and 17,135 males. The negative values shown in the upper right triangle had d < − 0.29, and all the values shown in the matrix were in the range from − 0.5 to 0.5. The standard covariates regressed out in this analysis were Age, BMI, education qualifications, smoking status, drinker status, Townsend deprivation index, head motion, and imaging site information. The cortical regions in the HCP-MMP atlas are illustrated in Figs. S1 and S2, and their names and divisions are shown in Table S1. The cortical divisions are separated by thick lines, and labelled at the bottom of the figure

